Austrian vs South American Poverty
COMPARE
Austrian
South American
Poverty
Poverty Comparison
Austrians
South Americans
11.2%
POVERTY
97.8/ 100
METRIC RATING
62nd/ 347
METRIC RANK
12.3%
POVERTY
48.7/ 100
METRIC RATING
175th/ 347
METRIC RANK
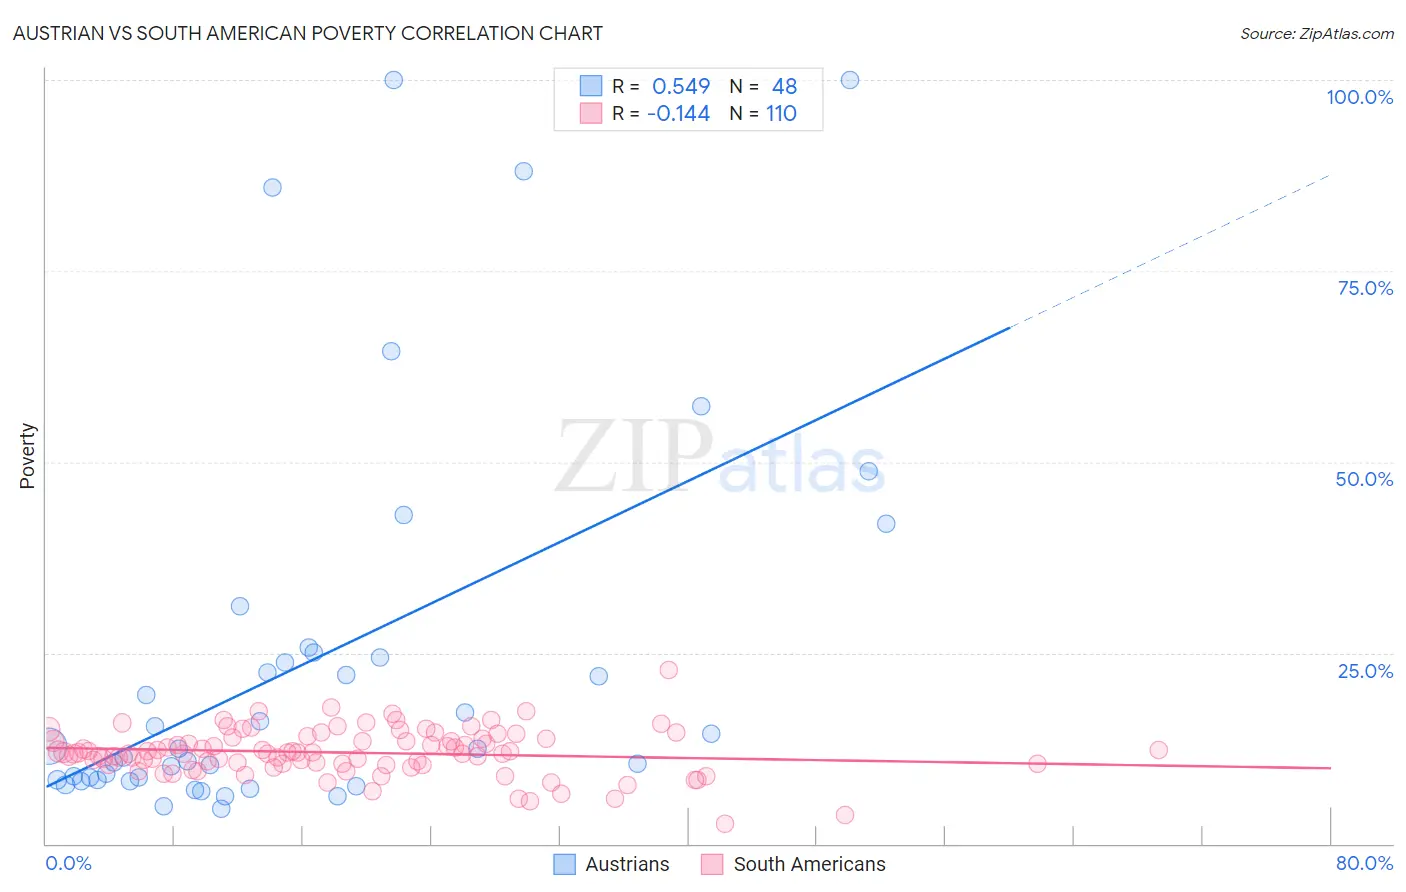
Austrian vs South American Poverty Correlation Chart
The statistical analysis conducted on geographies consisting of 451,775,249 people shows a substantial positive correlation between the proportion of Austrians and poverty level in the United States with a correlation coefficient (R) of 0.549 and weighted average of 11.2%. Similarly, the statistical analysis conducted on geographies consisting of 493,572,716 people shows a poor negative correlation between the proportion of South Americans and poverty level in the United States with a correlation coefficient (R) of -0.144 and weighted average of 12.3%, a difference of 10.3%.
Poverty Correlation Summary
| Measurement | Austrian | South American |
| Minimum | 4.6% | 2.6% |
| Maximum | 100.0% | 22.8% |
| Range | 95.4% | 20.2% |
| Mean | 23.7% | 11.9% |
| Median | 12.5% | 11.9% |
| Interquartile 25% (IQ1) | 8.4% | 10.4% |
| Interquartile 75% (IQ3) | 24.7% | 13.8% |
| Interquartile Range (IQR) | 16.3% | 3.4% |
| Standard Deviation (Sample) | 25.3% | 3.0% |
| Standard Deviation (Population) | 25.0% | 3.0% |
Similar Demographics by Poverty
Demographics Similar to Austrians by Poverty
In terms of poverty, the demographic groups most similar to Austrians are Ukrainian (11.2%, a difference of 0.0%), Immigrants from Italy (11.2%, a difference of 0.030%), Immigrants from Sri Lanka (11.2%, a difference of 0.10%), Swiss (11.2%, a difference of 0.22%), and Immigrants from Europe (11.2%, a difference of 0.26%).
| Demographics | Rating | Rank | Poverty |
| Immigrants | Serbia | 98.5 /100 | #55 | Exceptional 11.1% |
| Estonians | 98.2 /100 | #56 | Exceptional 11.1% |
| Scandinavians | 98.2 /100 | #57 | Exceptional 11.1% |
| Germans | 98.1 /100 | #58 | Exceptional 11.1% |
| Immigrants | Europe | 98.0 /100 | #59 | Exceptional 11.2% |
| Immigrants | Sri Lanka | 97.9 /100 | #60 | Exceptional 11.2% |
| Immigrants | Italy | 97.9 /100 | #61 | Exceptional 11.2% |
| Austrians | 97.8 /100 | #62 | Exceptional 11.2% |
| Ukrainians | 97.8 /100 | #63 | Exceptional 11.2% |
| Swiss | 97.7 /100 | #64 | Exceptional 11.2% |
| Immigrants | Asia | 97.5 /100 | #65 | Exceptional 11.2% |
| Immigrants | Netherlands | 97.5 /100 | #66 | Exceptional 11.2% |
| Immigrants | Australia | 97.4 /100 | #67 | Exceptional 11.2% |
| Slovaks | 97.4 /100 | #68 | Exceptional 11.2% |
| Serbians | 97.4 /100 | #69 | Exceptional 11.2% |
Demographics Similar to South Americans by Poverty
In terms of poverty, the demographic groups most similar to South Americans are Immigrants from Colombia (12.3%, a difference of 0.090%), Immigrants from Syria (12.3%, a difference of 0.12%), Lebanese (12.3%, a difference of 0.13%), Celtic (12.3%, a difference of 0.14%), and Immigrants from Portugal (12.3%, a difference of 0.18%).
| Demographics | Rating | Rank | Poverty |
| Immigrants | Venezuela | 56.5 /100 | #168 | Average 12.2% |
| Whites/Caucasians | 55.4 /100 | #169 | Average 12.3% |
| Immigrants | Oceania | 54.6 /100 | #170 | Average 12.3% |
| Immigrants | Spain | 51.3 /100 | #171 | Average 12.3% |
| Immigrants | Portugal | 50.5 /100 | #172 | Average 12.3% |
| Celtics | 50.1 /100 | #173 | Average 12.3% |
| Lebanese | 50.0 /100 | #174 | Average 12.3% |
| South Americans | 48.7 /100 | #175 | Average 12.3% |
| Immigrants | Colombia | 47.7 /100 | #176 | Average 12.3% |
| Immigrants | Syria | 47.5 /100 | #177 | Average 12.3% |
| Uruguayans | 44.7 /100 | #178 | Average 12.4% |
| Immigrants | Morocco | 44.0 /100 | #179 | Average 12.4% |
| Mongolians | 43.6 /100 | #180 | Average 12.4% |
| Immigrants | Afghanistan | 42.1 /100 | #181 | Average 12.4% |
| Immigrants | Cameroon | 41.7 /100 | #182 | Average 12.4% |