Austrian vs Immigrants from Norway 8th Grade
COMPARE
Austrian
Immigrants from Norway
8th Grade
8th Grade Comparison
Austrians
Immigrants from Norway
96.7%
8TH GRADE
99.9/ 100
METRIC RATING
53rd/ 347
METRIC RANK
96.2%
8TH GRADE
95.7/ 100
METRIC RATING
118th/ 347
METRIC RANK
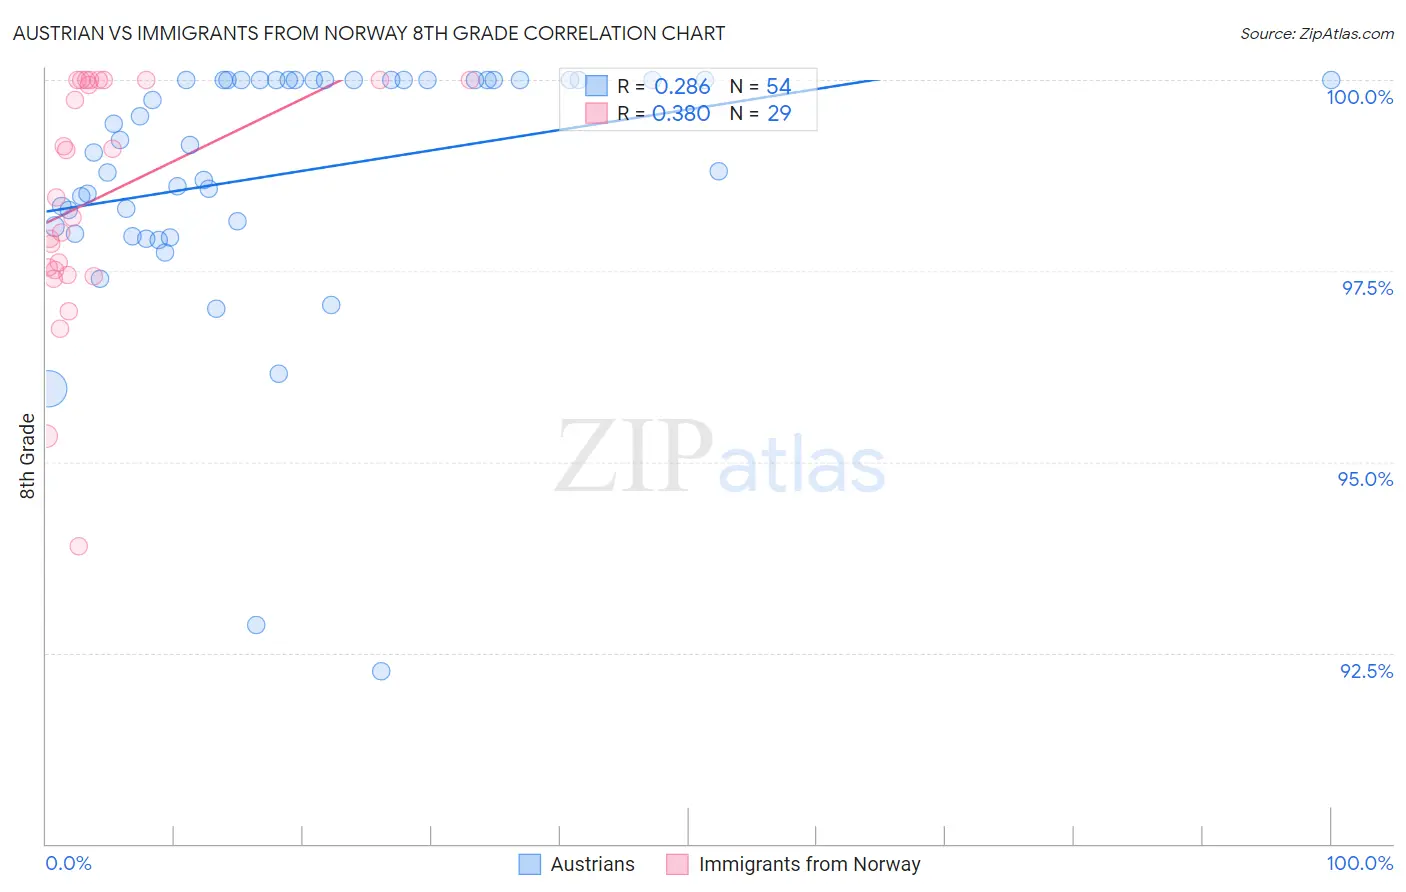
Austrian vs Immigrants from Norway 8th Grade Correlation Chart
The statistical analysis conducted on geographies consisting of 452,083,231 people shows a weak positive correlation between the proportion of Austrians and percentage of population with at least 8th grade education in the United States with a correlation coefficient (R) of 0.286 and weighted average of 96.7%. Similarly, the statistical analysis conducted on geographies consisting of 116,716,420 people shows a mild positive correlation between the proportion of Immigrants from Norway and percentage of population with at least 8th grade education in the United States with a correlation coefficient (R) of 0.380 and weighted average of 96.2%, a difference of 0.55%.
8th Grade Correlation Summary
| Measurement | Austrian | Immigrants from Norway |
| Minimum | 92.3% | 93.9% |
| Maximum | 100.0% | 100.0% |
| Range | 7.7% | 6.1% |
| Mean | 98.8% | 98.5% |
| Median | 99.2% | 98.5% |
| Interquartile 25% (IQ1) | 98.1% | 97.5% |
| Interquartile 75% (IQ3) | 100.0% | 100.0% |
| Interquartile Range (IQR) | 1.9% | 2.5% |
| Standard Deviation (Sample) | 1.6% | 1.6% |
| Standard Deviation (Population) | 1.6% | 1.5% |
Similar Demographics by 8th Grade
Demographics Similar to Austrians by 8th Grade
In terms of 8th grade, the demographic groups most similar to Austrians are Serbian (96.7%, a difference of 0.010%), Russian (96.7%, a difference of 0.010%), Australian (96.7%, a difference of 0.010%), Macedonian (96.7%, a difference of 0.010%), and Greek (96.8%, a difference of 0.020%).
| Demographics | Rating | Rank | 8th Grade |
| Czechoslovakians | 99.9 /100 | #46 | Exceptional 96.9% |
| Bulgarians | 99.9 /100 | #47 | Exceptional 96.9% |
| Slavs | 99.9 /100 | #48 | Exceptional 96.8% |
| Estonians | 99.9 /100 | #49 | Exceptional 96.8% |
| Immigrants | Scotland | 99.9 /100 | #50 | Exceptional 96.8% |
| Celtics | 99.9 /100 | #51 | Exceptional 96.8% |
| Greeks | 99.9 /100 | #52 | Exceptional 96.8% |
| Austrians | 99.9 /100 | #53 | Exceptional 96.7% |
| Serbians | 99.8 /100 | #54 | Exceptional 96.7% |
| Russians | 99.8 /100 | #55 | Exceptional 96.7% |
| Australians | 99.8 /100 | #56 | Exceptional 96.7% |
| Macedonians | 99.8 /100 | #57 | Exceptional 96.7% |
| Immigrants | Canada | 99.8 /100 | #58 | Exceptional 96.7% |
| Immigrants | North America | 99.8 /100 | #59 | Exceptional 96.7% |
| Immigrants | Northern Europe | 99.8 /100 | #60 | Exceptional 96.7% |
Demographics Similar to Immigrants from Norway by 8th Grade
In terms of 8th grade, the demographic groups most similar to Immigrants from Norway are Nonimmigrants (96.2%, a difference of 0.010%), Immigrants from Croatia (96.2%, a difference of 0.010%), Immigrants from Switzerland (96.2%, a difference of 0.020%), Immigrants from France (96.2%, a difference of 0.020%), and Immigrants from Bulgaria (96.2%, a difference of 0.020%).
| Demographics | Rating | Rank | 8th Grade |
| Shoshone | 96.8 /100 | #111 | Exceptional 96.3% |
| Syrians | 96.7 /100 | #112 | Exceptional 96.3% |
| Immigrants | Zimbabwe | 96.7 /100 | #113 | Exceptional 96.3% |
| Immigrants | Japan | 96.5 /100 | #114 | Exceptional 96.2% |
| Immigrants | Moldova | 96.5 /100 | #115 | Exceptional 96.2% |
| Immigrants | Nonimmigrants | 96.0 /100 | #116 | Exceptional 96.2% |
| Immigrants | Croatia | 96.0 /100 | #117 | Exceptional 96.2% |
| Immigrants | Norway | 95.7 /100 | #118 | Exceptional 96.2% |
| Immigrants | Switzerland | 95.3 /100 | #119 | Exceptional 96.2% |
| Immigrants | France | 95.3 /100 | #120 | Exceptional 96.2% |
| Immigrants | Bulgaria | 95.3 /100 | #121 | Exceptional 96.2% |
| Immigrants | Europe | 95.3 /100 | #122 | Exceptional 96.2% |
| Filipinos | 94.6 /100 | #123 | Exceptional 96.2% |
| Palestinians | 94.6 /100 | #124 | Exceptional 96.2% |
| Immigrants | Romania | 94.1 /100 | #125 | Exceptional 96.2% |