Austrian vs Puget Sound Salish Single Father Poverty
COMPARE
Austrian
Puget Sound Salish
Single Father Poverty
Single Father Poverty Comparison
Austrians
Puget Sound Salish
17.1%
SINGLE FATHER POVERTY
1.1/ 100
METRIC RATING
250th/ 347
METRIC RANK
15.2%
SINGLE FATHER POVERTY
99.8/ 100
METRIC RATING
60th/ 347
METRIC RANK
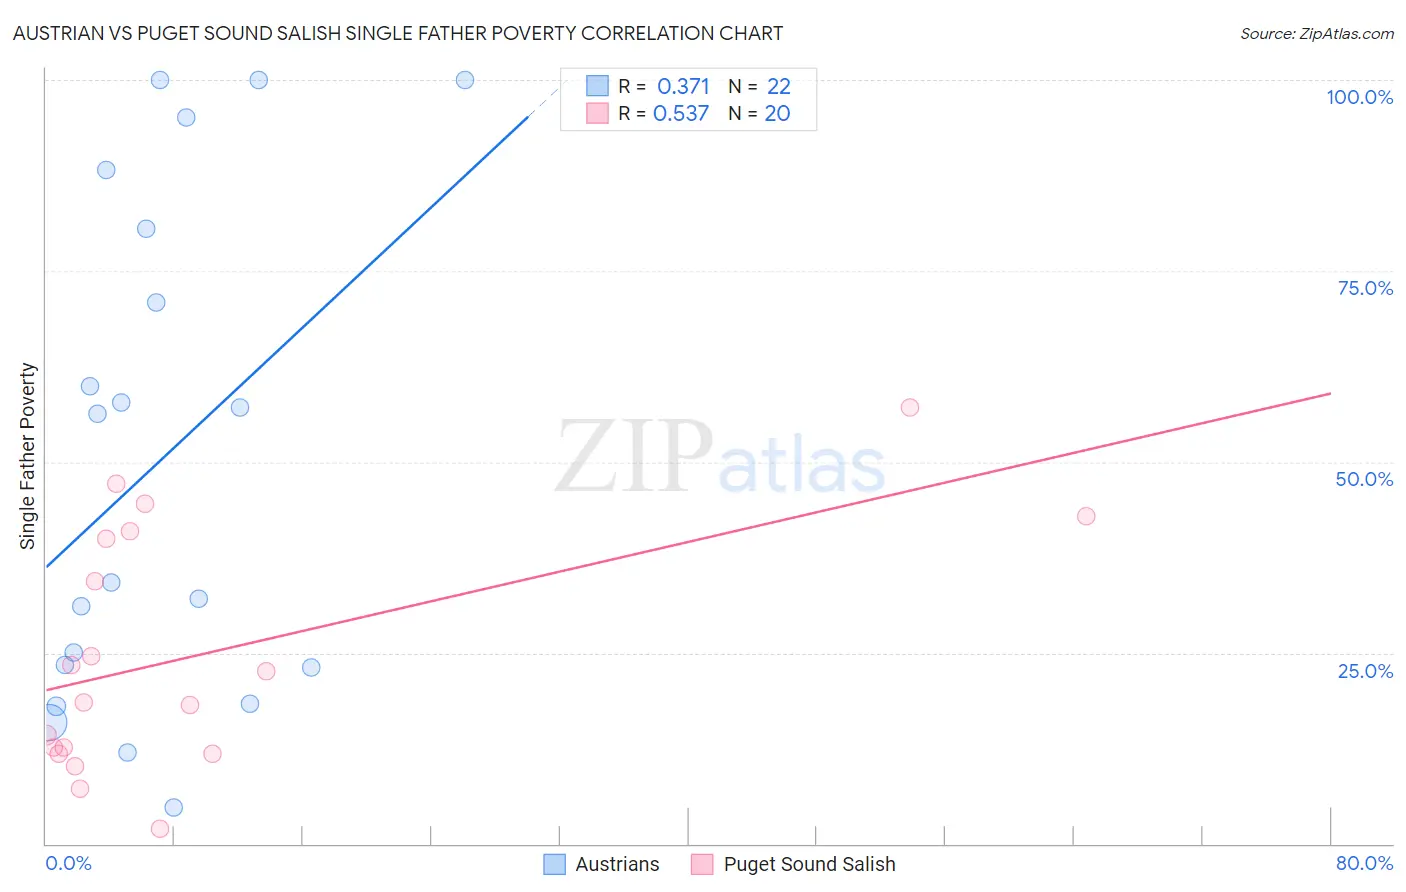
Austrian vs Puget Sound Salish Single Father Poverty Correlation Chart
The statistical analysis conducted on geographies consisting of 340,326,838 people shows a mild positive correlation between the proportion of Austrians and poverty level among single fathers in the United States with a correlation coefficient (R) of 0.371 and weighted average of 17.1%. Similarly, the statistical analysis conducted on geographies consisting of 42,233,093 people shows a substantial positive correlation between the proportion of Puget Sound Salish and poverty level among single fathers in the United States with a correlation coefficient (R) of 0.537 and weighted average of 15.2%, a difference of 12.9%.
Single Father Poverty Correlation Summary
| Measurement | Austrian | Puget Sound Salish |
| Minimum | 4.8% | 2.0% |
| Maximum | 100.0% | 57.1% |
| Range | 95.2% | 55.1% |
| Mean | 50.2% | 24.8% |
| Median | 45.2% | 20.5% |
| Interquartile 25% (IQ1) | 23.1% | 12.2% |
| Interquartile 75% (IQ3) | 80.6% | 40.5% |
| Interquartile Range (IQR) | 57.5% | 28.3% |
| Standard Deviation (Sample) | 32.6% | 15.8% |
| Standard Deviation (Population) | 31.8% | 15.4% |
Similar Demographics by Single Father Poverty
Demographics Similar to Austrians by Single Father Poverty
In terms of single father poverty, the demographic groups most similar to Austrians are Luxembourger (17.1%, a difference of 0.010%), Croatian (17.1%, a difference of 0.11%), Cree (17.1%, a difference of 0.11%), Canadian (17.1%, a difference of 0.13%), and Czechoslovakian (17.1%, a difference of 0.17%).
| Demographics | Rating | Rank | Single Father Poverty |
| Immigrants | Cabo Verde | 1.6 /100 | #243 | Tragic 17.0% |
| Hondurans | 1.6 /100 | #244 | Tragic 17.0% |
| Trinidadians and Tobagonians | 1.5 /100 | #245 | Tragic 17.0% |
| Immigrants | Ireland | 1.4 /100 | #246 | Tragic 17.1% |
| Greeks | 1.3 /100 | #247 | Tragic 17.1% |
| Czechoslovakians | 1.3 /100 | #248 | Tragic 17.1% |
| Canadians | 1.3 /100 | #249 | Tragic 17.1% |
| Austrians | 1.1 /100 | #250 | Tragic 17.1% |
| Luxembourgers | 1.1 /100 | #251 | Tragic 17.1% |
| Croatians | 1.0 /100 | #252 | Tragic 17.1% |
| Cree | 1.0 /100 | #253 | Tragic 17.1% |
| Immigrants | Honduras | 0.9 /100 | #254 | Tragic 17.1% |
| Sierra Leoneans | 0.8 /100 | #255 | Tragic 17.2% |
| Immigrants | Haiti | 0.8 /100 | #256 | Tragic 17.2% |
| Immigrants | Albania | 0.7 /100 | #257 | Tragic 17.2% |
Demographics Similar to Puget Sound Salish by Single Father Poverty
In terms of single father poverty, the demographic groups most similar to Puget Sound Salish are Immigrants from Bosnia and Herzegovina (15.2%, a difference of 0.040%), Immigrants from Armenia (15.2%, a difference of 0.050%), Immigrants from Sweden (15.2%, a difference of 0.14%), Bangladeshi (15.2%, a difference of 0.22%), and Immigrants from Malaysia (15.2%, a difference of 0.31%).
| Demographics | Rating | Rank | Single Father Poverty |
| Immigrants | Kenya | 99.9 /100 | #53 | Exceptional 15.0% |
| Immigrants | Uzbekistan | 99.9 /100 | #54 | Exceptional 15.0% |
| Immigrants | Bulgaria | 99.9 /100 | #55 | Exceptional 15.0% |
| Immigrants | Laos | 99.9 /100 | #56 | Exceptional 15.1% |
| Laotians | 99.9 /100 | #57 | Exceptional 15.1% |
| Hawaiians | 99.9 /100 | #58 | Exceptional 15.1% |
| Guamanians/Chamorros | 99.9 /100 | #59 | Exceptional 15.1% |
| Puget Sound Salish | 99.8 /100 | #60 | Exceptional 15.2% |
| Immigrants | Bosnia and Herzegovina | 99.8 /100 | #61 | Exceptional 15.2% |
| Immigrants | Armenia | 99.8 /100 | #62 | Exceptional 15.2% |
| Immigrants | Sweden | 99.8 /100 | #63 | Exceptional 15.2% |
| Bangladeshis | 99.8 /100 | #64 | Exceptional 15.2% |
| Immigrants | Malaysia | 99.8 /100 | #65 | Exceptional 15.2% |
| Immigrants | Moldova | 99.8 /100 | #66 | Exceptional 15.2% |
| Paraguayans | 99.7 /100 | #67 | Exceptional 15.2% |