Austrian vs Immigrants from Burma/Myanmar Unemployment Among Ages 30 to 34 years
COMPARE
Austrian
Immigrants from Burma/Myanmar
Unemployment Among Ages 30 to 34 years
Unemployment Among Ages 30 to 34 years Comparison
Austrians
Immigrants from Burma/Myanmar
5.4%
UNEMPLOYMENT AMONG AGES 30 TO 34 YEARS
59.0/ 100
METRIC RATING
161st/ 347
METRIC RANK
5.1%
UNEMPLOYMENT AMONG AGES 30 TO 34 YEARS
98.1/ 100
METRIC RATING
52nd/ 347
METRIC RANK
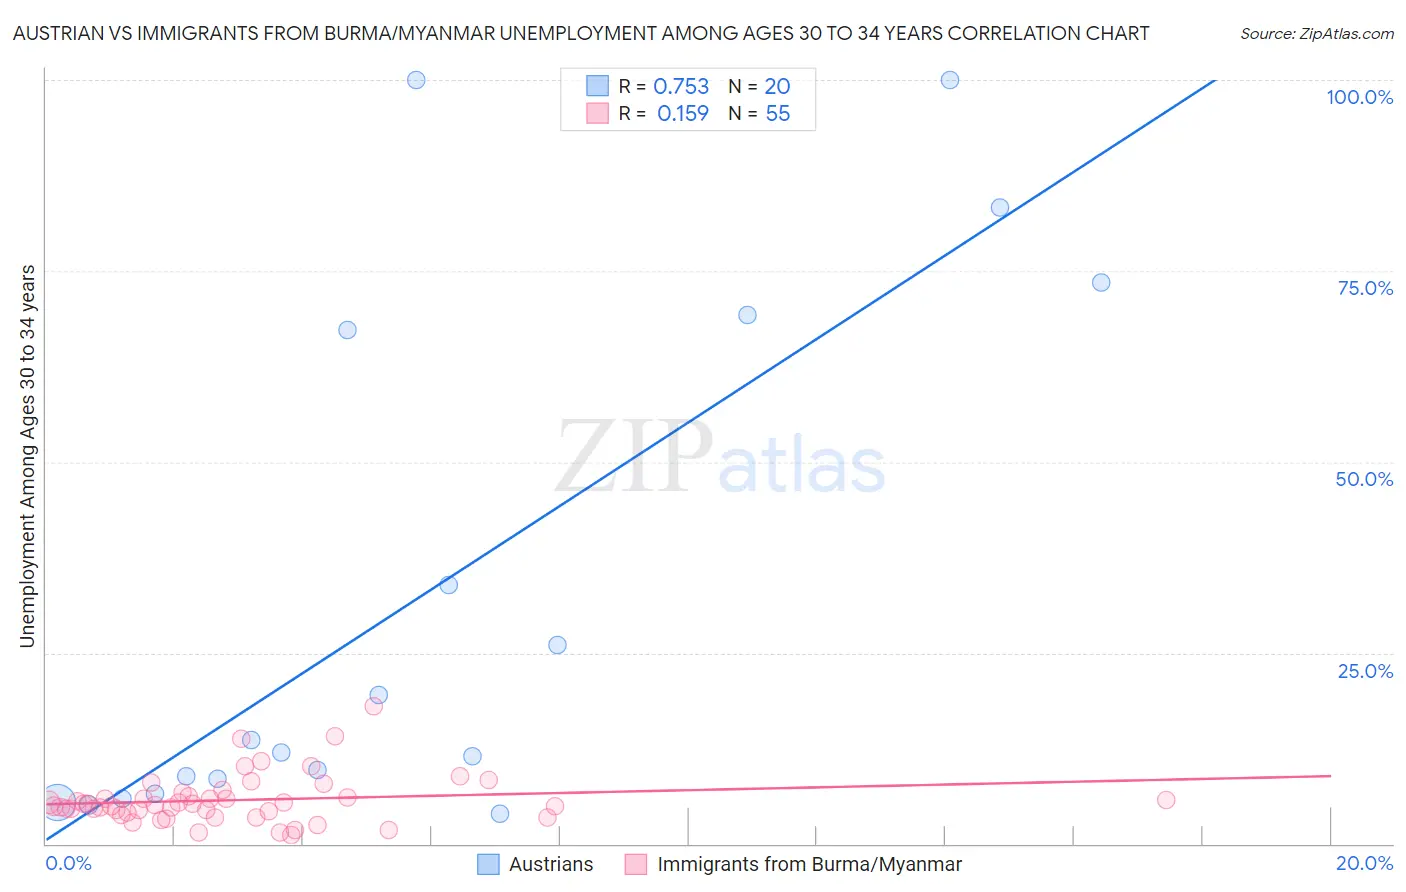
Austrian vs Immigrants from Burma/Myanmar Unemployment Among Ages 30 to 34 years Correlation Chart
The statistical analysis conducted on geographies consisting of 414,053,097 people shows a strong positive correlation between the proportion of Austrians and unemployment rate among population between the ages 30 and 34 in the United States with a correlation coefficient (R) of 0.753 and weighted average of 5.4%. Similarly, the statistical analysis conducted on geographies consisting of 168,858,886 people shows a poor positive correlation between the proportion of Immigrants from Burma/Myanmar and unemployment rate among population between the ages 30 and 34 in the United States with a correlation coefficient (R) of 0.159 and weighted average of 5.1%, a difference of 6.7%.
Unemployment Among Ages 30 to 34 years Correlation Summary
| Measurement | Austrian | Immigrants from Burma/Myanmar |
| Minimum | 3.9% | 1.2% |
| Maximum | 100.0% | 18.0% |
| Range | 96.1% | 16.8% |
| Mean | 33.2% | 5.7% |
| Median | 12.8% | 5.0% |
| Interquartile 25% (IQ1) | 7.5% | 4.1% |
| Interquartile 75% (IQ3) | 68.2% | 6.2% |
| Interquartile Range (IQR) | 60.7% | 2.1% |
| Standard Deviation (Sample) | 34.6% | 3.2% |
| Standard Deviation (Population) | 33.7% | 3.1% |
Similar Demographics by Unemployment Among Ages 30 to 34 years
Demographics Similar to Austrians by Unemployment Among Ages 30 to 34 years
In terms of unemployment among ages 30 to 34 years, the demographic groups most similar to Austrians are Immigrants from Scotland (5.4%, a difference of 0.020%), Brazilian (5.4%, a difference of 0.050%), Arab (5.4%, a difference of 0.090%), Basque (5.4%, a difference of 0.12%), and Immigrants from Croatia (5.4%, a difference of 0.15%).
| Demographics | Rating | Rank | Unemployment Among Ages 30 to 34 years |
| South Africans | 66.5 /100 | #154 | Good 5.4% |
| Immigrants | Hungary | 66.1 /100 | #155 | Good 5.4% |
| Czechoslovakians | 63.7 /100 | #156 | Good 5.4% |
| Albanians | 63.7 /100 | #157 | Good 5.4% |
| Immigrants | Belarus | 62.7 /100 | #158 | Good 5.4% |
| Immigrants | Croatia | 61.0 /100 | #159 | Good 5.4% |
| Immigrants | Scotland | 59.3 /100 | #160 | Average 5.4% |
| Austrians | 59.0 /100 | #161 | Average 5.4% |
| Brazilians | 58.2 /100 | #162 | Average 5.4% |
| Arabs | 57.7 /100 | #163 | Average 5.4% |
| Basques | 57.3 /100 | #164 | Average 5.4% |
| Welsh | 56.3 /100 | #165 | Average 5.4% |
| Immigrants | Thailand | 55.6 /100 | #166 | Average 5.4% |
| English | 54.8 /100 | #167 | Average 5.4% |
| South Americans | 52.9 /100 | #168 | Average 5.4% |
Demographics Similar to Immigrants from Burma/Myanmar by Unemployment Among Ages 30 to 34 years
In terms of unemployment among ages 30 to 34 years, the demographic groups most similar to Immigrants from Burma/Myanmar are Turkish (5.1%, a difference of 0.040%), Cuban (5.1%, a difference of 0.050%), Puget Sound Salish (5.1%, a difference of 0.070%), Immigrants from Malaysia (5.1%, a difference of 0.14%), and Immigrants from Morocco (5.1%, a difference of 0.23%).
| Demographics | Rating | Rank | Unemployment Among Ages 30 to 34 years |
| Yugoslavians | 98.6 /100 | #45 | Exceptional 5.1% |
| Immigrants | Congo | 98.4 /100 | #46 | Exceptional 5.1% |
| Cypriots | 98.4 /100 | #47 | Exceptional 5.1% |
| Assyrians/Chaldeans/Syriacs | 98.4 /100 | #48 | Exceptional 5.1% |
| Immigrants | Malaysia | 98.3 /100 | #49 | Exceptional 5.1% |
| Puget Sound Salish | 98.2 /100 | #50 | Exceptional 5.1% |
| Turks | 98.2 /100 | #51 | Exceptional 5.1% |
| Immigrants | Burma/Myanmar | 98.1 /100 | #52 | Exceptional 5.1% |
| Cubans | 98.1 /100 | #53 | Exceptional 5.1% |
| Immigrants | Morocco | 97.9 /100 | #54 | Exceptional 5.1% |
| Chinese | 97.7 /100 | #55 | Exceptional 5.1% |
| Immigrants | Serbia | 97.4 /100 | #56 | Exceptional 5.1% |
| Immigrants | China | 97.2 /100 | #57 | Exceptional 5.1% |
| Asians | 97.2 /100 | #58 | Exceptional 5.1% |
| Swedes | 97.1 /100 | #59 | Exceptional 5.1% |