Immigrants from Spain vs Swiss Child Poverty Among Boys Under 16
COMPARE
Immigrants from Spain
Swiss
Child Poverty Among Boys Under 16
Child Poverty Among Boys Under 16 Comparison
Immigrants from Spain
Swiss
15.6%
CHILD POVERTY AMONG BOYS UNDER 16
87.1/ 100
METRIC RATING
137th/ 347
METRIC RANK
14.8%
CHILD POVERTY AMONG BOYS UNDER 16
97.3/ 100
METRIC RATING
84th/ 347
METRIC RANK
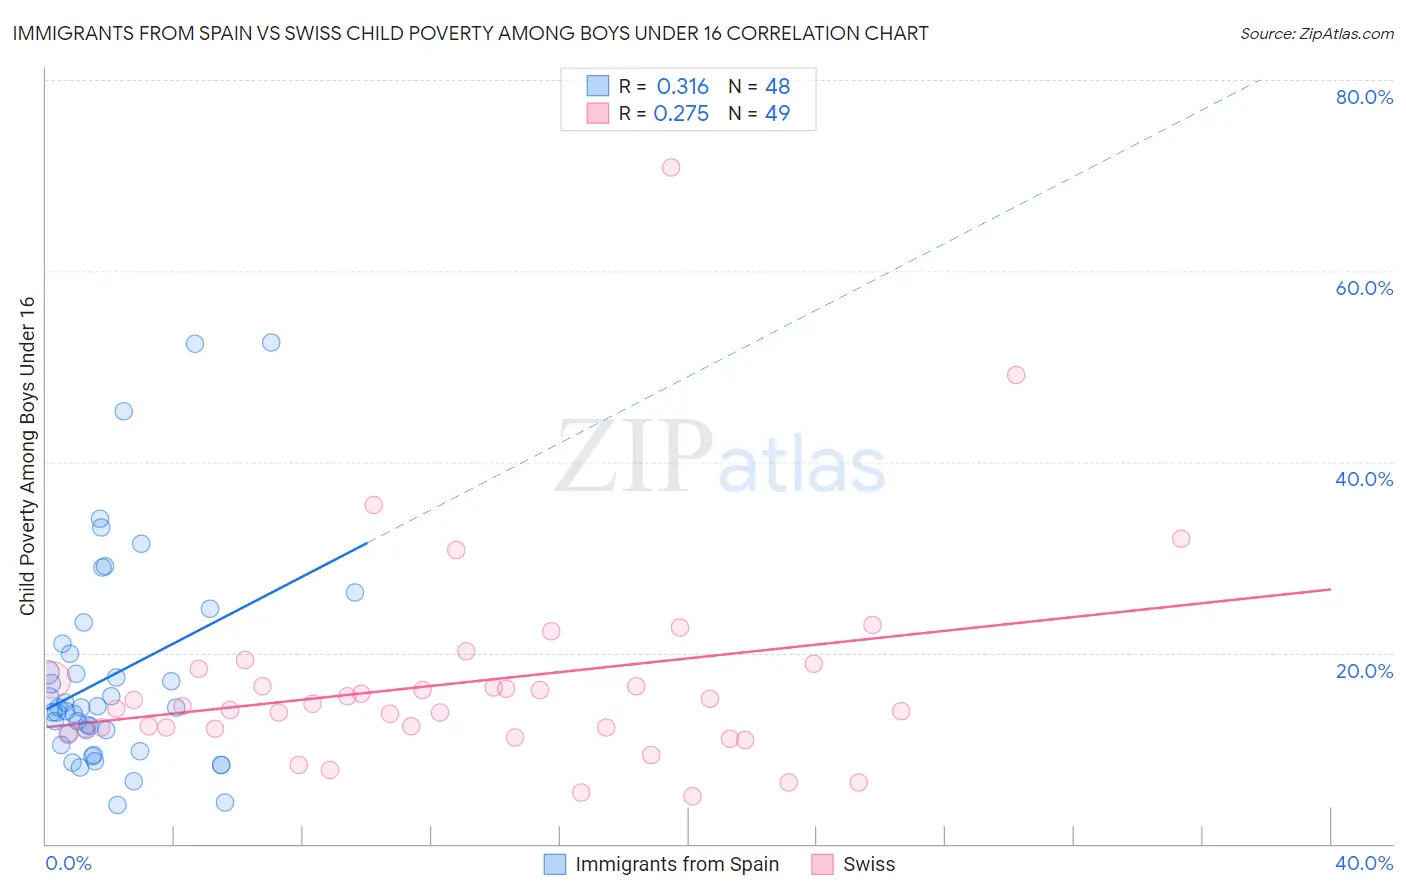
Immigrants from Spain vs Swiss Child Poverty Among Boys Under 16 Correlation Chart
The statistical analysis conducted on geographies consisting of 236,961,391 people shows a mild positive correlation between the proportion of Immigrants from Spain and poverty level among boys under the age of 16 in the United States with a correlation coefficient (R) of 0.316 and weighted average of 15.6%. Similarly, the statistical analysis conducted on geographies consisting of 453,201,840 people shows a weak positive correlation between the proportion of Swiss and poverty level among boys under the age of 16 in the United States with a correlation coefficient (R) of 0.275 and weighted average of 14.8%, a difference of 5.2%.
Child Poverty Among Boys Under 16 Correlation Summary
| Measurement | Immigrants from Spain | Swiss |
| Minimum | 4.0% | 5.0% |
| Maximum | 52.5% | 70.8% |
| Range | 48.5% | 65.8% |
| Mean | 17.7% | 16.9% |
| Median | 14.2% | 14.4% |
| Interquartile 25% (IQ1) | 10.9% | 12.1% |
| Interquartile 75% (IQ3) | 20.4% | 17.7% |
| Interquartile Range (IQR) | 9.5% | 5.6% |
| Standard Deviation (Sample) | 11.1% | 11.1% |
| Standard Deviation (Population) | 11.0% | 11.0% |
Similar Demographics by Child Poverty Among Boys Under 16
Demographics Similar to Immigrants from Spain by Child Poverty Among Boys Under 16
In terms of child poverty among boys under 16, the demographic groups most similar to Immigrants from Spain are Icelander (15.5%, a difference of 0.10%), Portuguese (15.5%, a difference of 0.11%), Immigrants from Southern Europe (15.6%, a difference of 0.15%), Albanian (15.6%, a difference of 0.15%), and Peruvian (15.5%, a difference of 0.29%).
| Demographics | Rating | Rank | Child Poverty Among Boys Under 16 |
| Mongolians | 90.2 /100 | #130 | Exceptional 15.4% |
| Immigrants | Western Europe | 90.0 /100 | #131 | Exceptional 15.4% |
| Immigrants | Kazakhstan | 88.7 /100 | #132 | Excellent 15.5% |
| Welsh | 88.3 /100 | #133 | Excellent 15.5% |
| Peruvians | 88.1 /100 | #134 | Excellent 15.5% |
| Portuguese | 87.5 /100 | #135 | Excellent 15.5% |
| Icelanders | 87.5 /100 | #136 | Excellent 15.5% |
| Immigrants | Spain | 87.1 /100 | #137 | Excellent 15.6% |
| Immigrants | Southern Europe | 86.5 /100 | #138 | Excellent 15.6% |
| Albanians | 86.5 /100 | #139 | Excellent 15.6% |
| Immigrants | Kuwait | 85.6 /100 | #140 | Excellent 15.6% |
| Slavs | 84.5 /100 | #141 | Excellent 15.7% |
| Immigrants | Hungary | 84.1 /100 | #142 | Excellent 15.7% |
| Immigrants | Fiji | 83.6 /100 | #143 | Excellent 15.7% |
| Immigrants | Peru | 83.5 /100 | #144 | Excellent 15.7% |
Demographics Similar to Swiss by Child Poverty Among Boys Under 16
In terms of child poverty among boys under 16, the demographic groups most similar to Swiss are Taiwanese (14.8%, a difference of 0.040%), German (14.8%, a difference of 0.11%), Immigrants from South Africa (14.8%, a difference of 0.12%), Northern European (14.8%, a difference of 0.16%), and Immigrants from North America (14.8%, a difference of 0.18%).
| Demographics | Rating | Rank | Child Poverty Among Boys Under 16 |
| Macedonians | 97.9 /100 | #77 | Exceptional 14.7% |
| Egyptians | 97.8 /100 | #78 | Exceptional 14.7% |
| Immigrants | Eastern Europe | 97.8 /100 | #79 | Exceptional 14.7% |
| Immigrants | Russia | 97.7 /100 | #80 | Exceptional 14.7% |
| Immigrants | Canada | 97.6 /100 | #81 | Exceptional 14.7% |
| Ukrainians | 97.6 /100 | #82 | Exceptional 14.7% |
| Immigrants | South Africa | 97.4 /100 | #83 | Exceptional 14.8% |
| Swiss | 97.3 /100 | #84 | Exceptional 14.8% |
| Taiwanese | 97.3 /100 | #85 | Exceptional 14.8% |
| Germans | 97.2 /100 | #86 | Exceptional 14.8% |
| Northern Europeans | 97.2 /100 | #87 | Exceptional 14.8% |
| Immigrants | North America | 97.1 /100 | #88 | Exceptional 14.8% |
| Immigrants | Argentina | 97.1 /100 | #89 | Exceptional 14.8% |
| Austrians | 97.1 /100 | #90 | Exceptional 14.8% |
| Paraguayans | 96.8 /100 | #91 | Exceptional 14.9% |