Immigrants from Belarus vs Immigrants from Cambodia Receiving Food Stamps
COMPARE
Immigrants from Belarus
Immigrants from Cambodia
Receiving Food Stamps
Receiving Food Stamps Comparison
Immigrants from Belarus
Immigrants from Cambodia
11.5%
RECEIVING FOOD STAMPS
62.8/ 100
METRIC RATING
166th/ 347
METRIC RANK
13.9%
RECEIVING FOOD STAMPS
0.5/ 100
METRIC RATING
250th/ 347
METRIC RANK
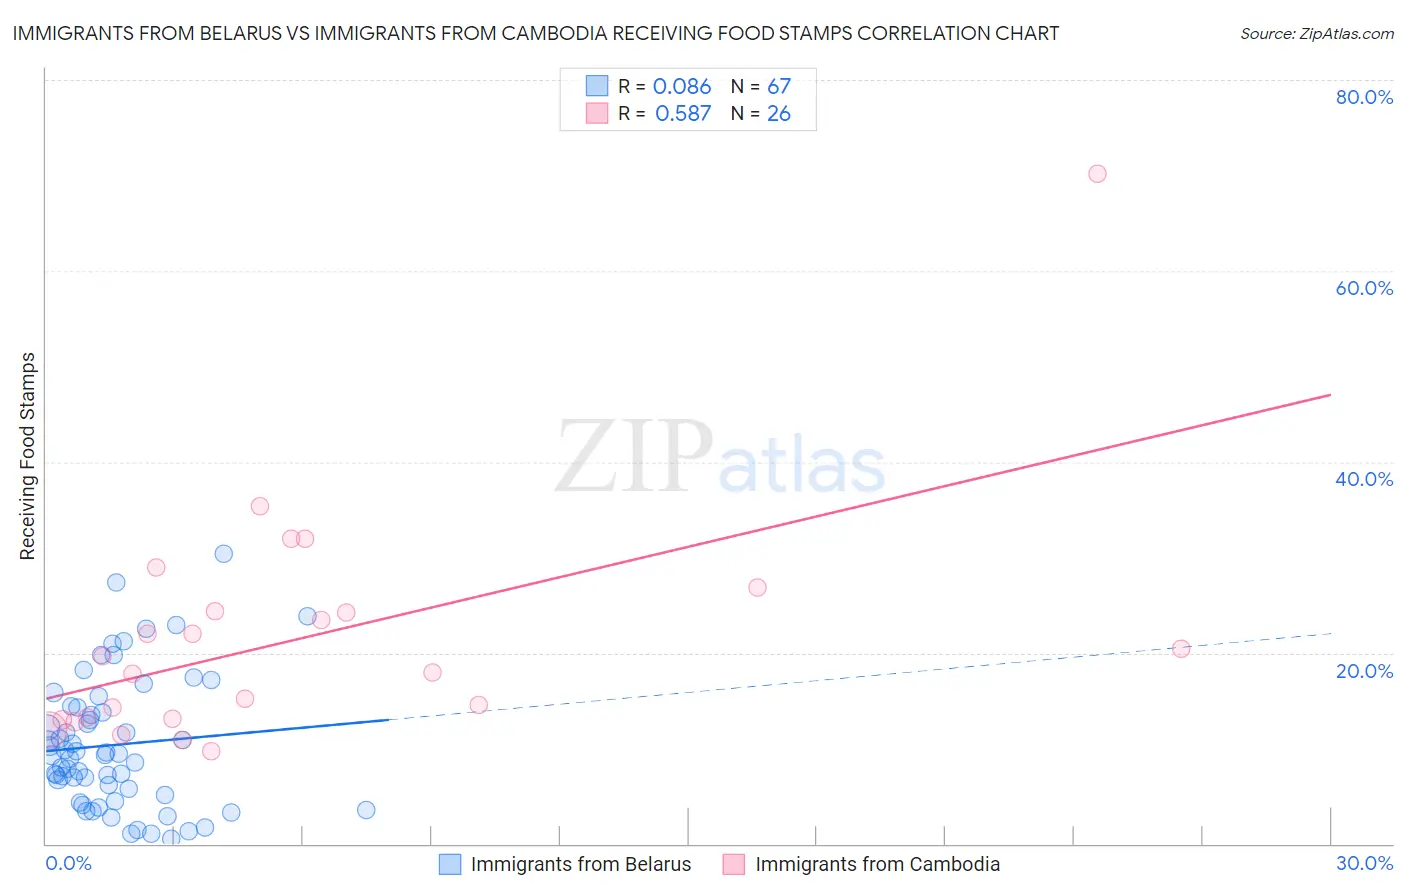
Immigrants from Belarus vs Immigrants from Cambodia Receiving Food Stamps Correlation Chart
The statistical analysis conducted on geographies consisting of 149,924,892 people shows a slight positive correlation between the proportion of Immigrants from Belarus and percentage of population receiving government assistance and/or food stamps in the United States with a correlation coefficient (R) of 0.086 and weighted average of 11.5%. Similarly, the statistical analysis conducted on geographies consisting of 205,011,401 people shows a substantial positive correlation between the proportion of Immigrants from Cambodia and percentage of population receiving government assistance and/or food stamps in the United States with a correlation coefficient (R) of 0.587 and weighted average of 13.9%, a difference of 20.4%.
Receiving Food Stamps Correlation Summary
| Measurement | Immigrants from Belarus | Immigrants from Cambodia |
| Minimum | 0.50% | 9.7% |
| Maximum | 30.4% | 70.2% |
| Range | 29.9% | 60.5% |
| Mean | 10.4% | 21.4% |
| Median | 9.3% | 18.8% |
| Interquartile 25% (IQ1) | 5.1% | 13.1% |
| Interquartile 75% (IQ3) | 14.3% | 24.3% |
| Interquartile Range (IQR) | 9.2% | 11.2% |
| Standard Deviation (Sample) | 6.8% | 12.3% |
| Standard Deviation (Population) | 6.8% | 12.1% |
Similar Demographics by Receiving Food Stamps
Demographics Similar to Immigrants from Belarus by Receiving Food Stamps
In terms of receiving food stamps, the demographic groups most similar to Immigrants from Belarus are Arab (11.5%, a difference of 0.30%), Immigrants from Chile (11.5%, a difference of 0.35%), Kenyan (11.6%, a difference of 0.38%), Immigrants from Southern Europe (11.5%, a difference of 0.47%), and Tlingit-Haida (11.6%, a difference of 0.54%).
| Demographics | Rating | Rank | Receiving Food Stamps |
| Immigrants | Oceania | 70.4 /100 | #159 | Good 11.4% |
| French Canadians | 69.5 /100 | #160 | Good 11.4% |
| Pennsylvania Germans | 68.4 /100 | #161 | Good 11.4% |
| Alsatians | 68.0 /100 | #162 | Good 11.4% |
| Immigrants | Southern Europe | 65.8 /100 | #163 | Good 11.5% |
| Immigrants | Chile | 65.0 /100 | #164 | Good 11.5% |
| Arabs | 64.7 /100 | #165 | Good 11.5% |
| Immigrants | Belarus | 62.8 /100 | #166 | Good 11.5% |
| Kenyans | 60.2 /100 | #167 | Good 11.6% |
| Tlingit-Haida | 59.1 /100 | #168 | Average 11.6% |
| Immigrants | Eastern Africa | 58.3 /100 | #169 | Average 11.6% |
| Costa Ricans | 57.9 /100 | #170 | Average 11.6% |
| Immigrants | Western Asia | 56.4 /100 | #171 | Average 11.6% |
| Guamanians/Chamorros | 54.2 /100 | #172 | Average 11.7% |
| Immigrants | Syria | 53.4 /100 | #173 | Average 11.7% |
Demographics Similar to Immigrants from Cambodia by Receiving Food Stamps
In terms of receiving food stamps, the demographic groups most similar to Immigrants from Cambodia are Yaqui (13.9%, a difference of 0.070%), Indonesian (13.9%, a difference of 0.17%), Ghanaian (14.0%, a difference of 0.52%), Immigrants from Laos (13.8%, a difference of 0.80%), and Spanish American (14.0%, a difference of 0.89%).
| Demographics | Rating | Rank | Receiving Food Stamps |
| Somalis | 0.9 /100 | #243 | Tragic 13.7% |
| Cajuns | 0.9 /100 | #244 | Tragic 13.7% |
| Immigrants | Somalia | 0.9 /100 | #245 | Tragic 13.7% |
| Cree | 0.8 /100 | #246 | Tragic 13.7% |
| Mexican American Indians | 0.7 /100 | #247 | Tragic 13.8% |
| Immigrants | Laos | 0.7 /100 | #248 | Tragic 13.8% |
| Indonesians | 0.6 /100 | #249 | Tragic 13.9% |
| Immigrants | Cambodia | 0.5 /100 | #250 | Tragic 13.9% |
| Yaqui | 0.5 /100 | #251 | Tragic 13.9% |
| Ghanaians | 0.5 /100 | #252 | Tragic 14.0% |
| Spanish Americans | 0.4 /100 | #253 | Tragic 14.0% |
| Marshallese | 0.3 /100 | #254 | Tragic 14.1% |
| Sub-Saharan Africans | 0.3 /100 | #255 | Tragic 14.1% |
| Japanese | 0.3 /100 | #256 | Tragic 14.1% |
| Arapaho | 0.3 /100 | #257 | Tragic 14.1% |