English vs Immigrants from Cambodia Receiving Food Stamps
COMPARE
English
Immigrants from Cambodia
Receiving Food Stamps
Receiving Food Stamps Comparison
English
Immigrants from Cambodia
9.8%
RECEIVING FOOD STAMPS
99.2/ 100
METRIC RATING
61st/ 347
METRIC RANK
13.9%
RECEIVING FOOD STAMPS
0.5/ 100
METRIC RATING
250th/ 347
METRIC RANK
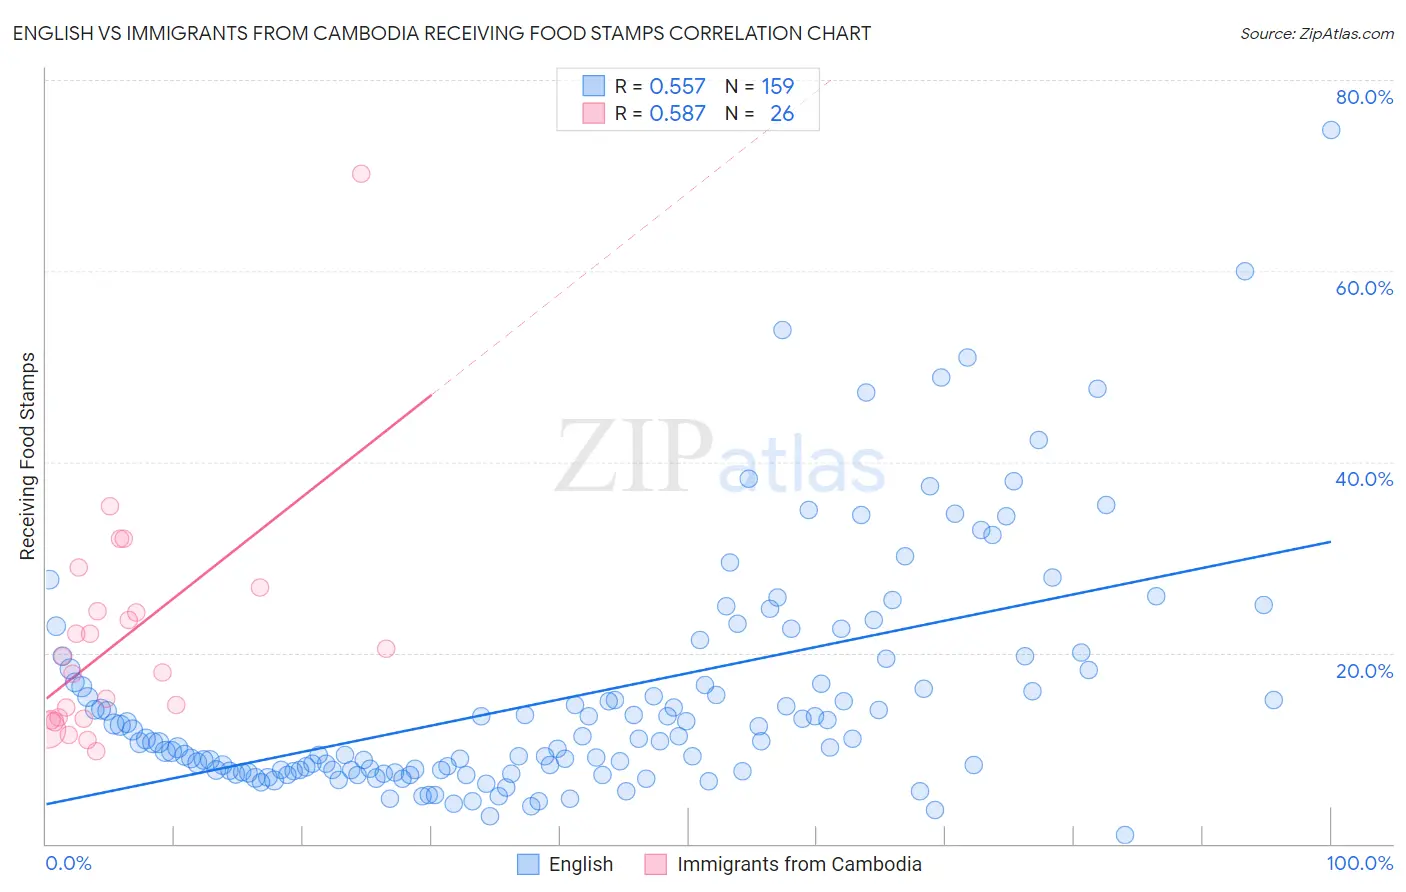
English vs Immigrants from Cambodia Receiving Food Stamps Correlation Chart
The statistical analysis conducted on geographies consisting of 575,562,331 people shows a substantial positive correlation between the proportion of English and percentage of population receiving government assistance and/or food stamps in the United States with a correlation coefficient (R) of 0.557 and weighted average of 9.8%. Similarly, the statistical analysis conducted on geographies consisting of 205,011,401 people shows a substantial positive correlation between the proportion of Immigrants from Cambodia and percentage of population receiving government assistance and/or food stamps in the United States with a correlation coefficient (R) of 0.587 and weighted average of 13.9%, a difference of 42.2%.
Receiving Food Stamps Correlation Summary
| Measurement | English | Immigrants from Cambodia |
| Minimum | 0.90% | 9.7% |
| Maximum | 74.8% | 70.2% |
| Range | 73.9% | 60.5% |
| Mean | 15.3% | 21.4% |
| Median | 10.8% | 18.8% |
| Interquartile 25% (IQ1) | 7.6% | 13.1% |
| Interquartile 75% (IQ3) | 18.2% | 24.3% |
| Interquartile Range (IQR) | 10.6% | 11.2% |
| Standard Deviation (Sample) | 12.2% | 12.3% |
| Standard Deviation (Population) | 12.1% | 12.1% |
Similar Demographics by Receiving Food Stamps
Demographics Similar to English by Receiving Food Stamps
In terms of receiving food stamps, the demographic groups most similar to English are Immigrants from Bulgaria (9.8%, a difference of 0.080%), Chinese (9.8%, a difference of 0.11%), German (9.7%, a difference of 0.14%), Immigrants from North America (9.8%, a difference of 0.19%), and British (9.7%, a difference of 0.24%).
| Demographics | Rating | Rank | Receiving Food Stamps |
| Swiss | 99.3 /100 | #54 | Exceptional 9.7% |
| Immigrants | Switzerland | 99.3 /100 | #55 | Exceptional 9.7% |
| Immigrants | Canada | 99.3 /100 | #56 | Exceptional 9.7% |
| Greeks | 99.3 /100 | #57 | Exceptional 9.7% |
| Scandinavians | 99.2 /100 | #58 | Exceptional 9.7% |
| British | 99.2 /100 | #59 | Exceptional 9.7% |
| Germans | 99.2 /100 | #60 | Exceptional 9.7% |
| English | 99.2 /100 | #61 | Exceptional 9.8% |
| Immigrants | Bulgaria | 99.2 /100 | #62 | Exceptional 9.8% |
| Chinese | 99.2 /100 | #63 | Exceptional 9.8% |
| Immigrants | North America | 99.2 /100 | #64 | Exceptional 9.8% |
| Immigrants | Turkey | 99.1 /100 | #65 | Exceptional 9.8% |
| Slovenes | 99.1 /100 | #66 | Exceptional 9.8% |
| Immigrants | Indonesia | 99.0 /100 | #67 | Exceptional 9.8% |
| Northern Europeans | 99.0 /100 | #68 | Exceptional 9.8% |
Demographics Similar to Immigrants from Cambodia by Receiving Food Stamps
In terms of receiving food stamps, the demographic groups most similar to Immigrants from Cambodia are Yaqui (13.9%, a difference of 0.070%), Indonesian (13.9%, a difference of 0.17%), Ghanaian (14.0%, a difference of 0.52%), Immigrants from Laos (13.8%, a difference of 0.80%), and Spanish American (14.0%, a difference of 0.89%).
| Demographics | Rating | Rank | Receiving Food Stamps |
| Somalis | 0.9 /100 | #243 | Tragic 13.7% |
| Cajuns | 0.9 /100 | #244 | Tragic 13.7% |
| Immigrants | Somalia | 0.9 /100 | #245 | Tragic 13.7% |
| Cree | 0.8 /100 | #246 | Tragic 13.7% |
| Mexican American Indians | 0.7 /100 | #247 | Tragic 13.8% |
| Immigrants | Laos | 0.7 /100 | #248 | Tragic 13.8% |
| Indonesians | 0.6 /100 | #249 | Tragic 13.9% |
| Immigrants | Cambodia | 0.5 /100 | #250 | Tragic 13.9% |
| Yaqui | 0.5 /100 | #251 | Tragic 13.9% |
| Ghanaians | 0.5 /100 | #252 | Tragic 14.0% |
| Spanish Americans | 0.4 /100 | #253 | Tragic 14.0% |
| Marshallese | 0.3 /100 | #254 | Tragic 14.1% |
| Sub-Saharan Africans | 0.3 /100 | #255 | Tragic 14.1% |
| Japanese | 0.3 /100 | #256 | Tragic 14.1% |
| Arapaho | 0.3 /100 | #257 | Tragic 14.1% |