Assyrian/Chaldean/Syriac vs Choctaw Seniors Poverty Over the Age of 65
COMPARE
Assyrian/Chaldean/Syriac
Choctaw
Seniors Poverty Over the Age of 65
Seniors Poverty Over the Age of 65 Comparison
Assyrians/Chaldeans/Syriacs
Choctaw
9.6%
SENIORS POVERTY OVER THE AGE OF 65
99.6/ 100
METRIC RATING
40th/ 347
METRIC RANK
11.4%
SENIORS POVERTY OVER THE AGE OF 65
14.5/ 100
METRIC RATING
206th/ 347
METRIC RANK
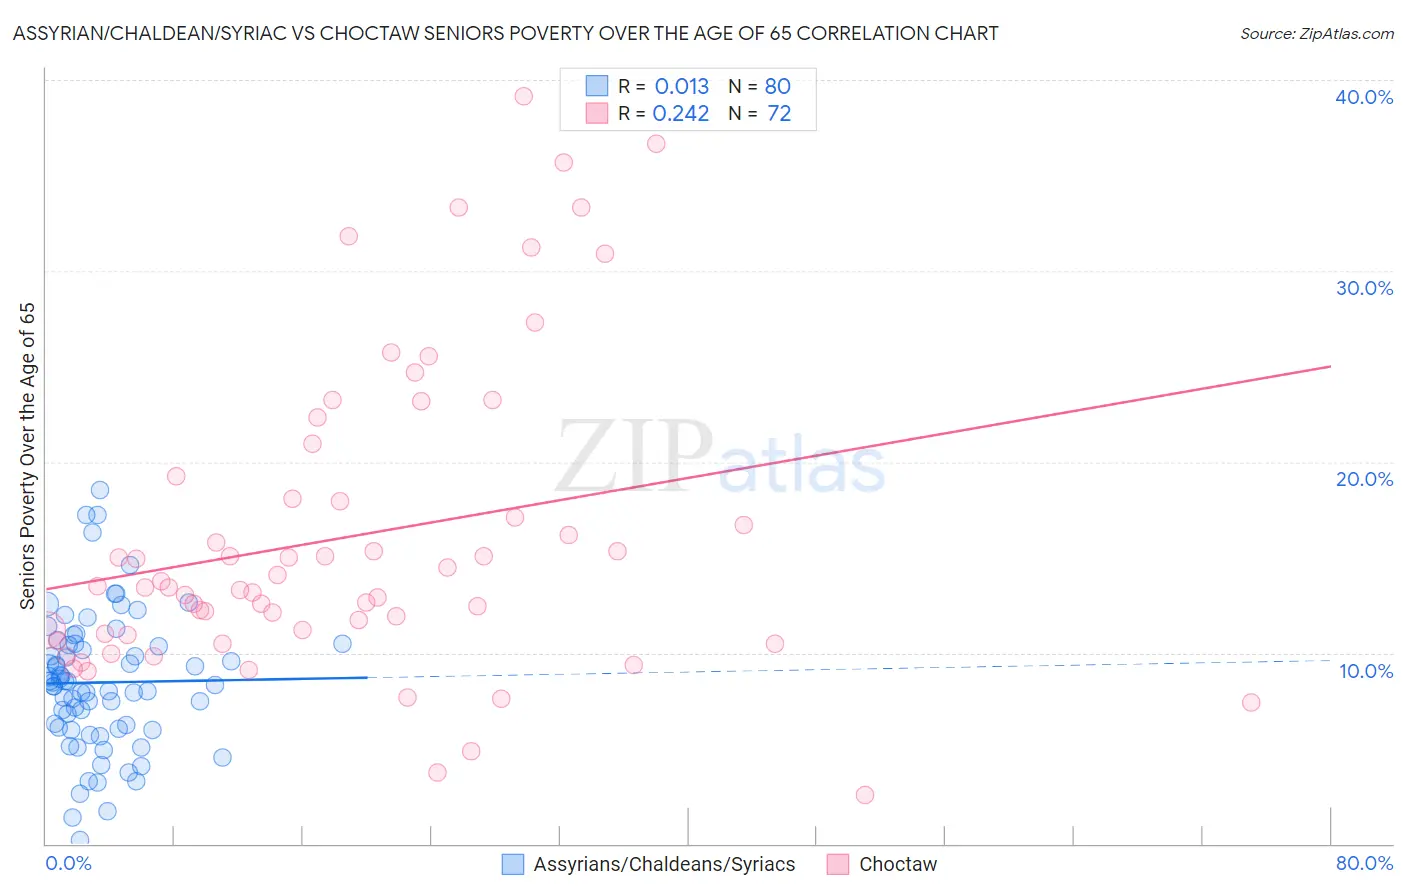
Assyrian/Chaldean/Syriac vs Choctaw Seniors Poverty Over the Age of 65 Correlation Chart
The statistical analysis conducted on geographies consisting of 110,236,385 people shows no correlation between the proportion of Assyrians/Chaldeans/Syriacs and poverty level among seniors over the age of 65 in the United States with a correlation coefficient (R) of 0.013 and weighted average of 9.6%. Similarly, the statistical analysis conducted on geographies consisting of 268,951,728 people shows a weak positive correlation between the proportion of Choctaw and poverty level among seniors over the age of 65 in the United States with a correlation coefficient (R) of 0.242 and weighted average of 11.4%, a difference of 18.6%.
Seniors Poverty Over the Age of 65 Correlation Summary
| Measurement | Assyrian/Chaldean/Syriac | Choctaw |
| Minimum | 0.19% | 2.6% |
| Maximum | 18.5% | 39.1% |
| Range | 18.3% | 36.6% |
| Mean | 8.4% | 16.1% |
| Median | 8.4% | 13.5% |
| Interquartile 25% (IQ1) | 6.1% | 11.0% |
| Interquartile 75% (IQ3) | 10.4% | 18.7% |
| Interquartile Range (IQR) | 4.4% | 7.7% |
| Standard Deviation (Sample) | 3.6% | 8.1% |
| Standard Deviation (Population) | 3.6% | 8.1% |
Similar Demographics by Seniors Poverty Over the Age of 65
Demographics Similar to Assyrians/Chaldeans/Syriacs by Seniors Poverty Over the Age of 65
In terms of seniors poverty over the age of 65, the demographic groups most similar to Assyrians/Chaldeans/Syriacs are Greek (9.6%, a difference of 0.12%), Immigrants from North Macedonia (9.6%, a difference of 0.16%), Zimbabwean (9.6%, a difference of 0.32%), Eastern European (9.6%, a difference of 0.42%), and Austrian (9.6%, a difference of 0.51%).
| Demographics | Rating | Rank | Seniors Poverty Over the Age of 65 |
| Native Hawaiians | 99.8 /100 | #33 | Exceptional 9.4% |
| British | 99.8 /100 | #34 | Exceptional 9.4% |
| Latvians | 99.8 /100 | #35 | Exceptional 9.5% |
| Czechoslovakians | 99.8 /100 | #36 | Exceptional 9.5% |
| Scotch-Irish | 99.7 /100 | #37 | Exceptional 9.5% |
| Belgians | 99.7 /100 | #38 | Exceptional 9.5% |
| Greeks | 99.6 /100 | #39 | Exceptional 9.6% |
| Assyrians/Chaldeans/Syriacs | 99.6 /100 | #40 | Exceptional 9.6% |
| Immigrants | North Macedonia | 99.6 /100 | #41 | Exceptional 9.6% |
| Zimbabweans | 99.6 /100 | #42 | Exceptional 9.6% |
| Eastern Europeans | 99.6 /100 | #43 | Exceptional 9.6% |
| Austrians | 99.5 /100 | #44 | Exceptional 9.6% |
| Estonians | 99.5 /100 | #45 | Exceptional 9.6% |
| Immigrants | Taiwan | 99.5 /100 | #46 | Exceptional 9.7% |
| Immigrants | South Central Asia | 99.5 /100 | #47 | Exceptional 9.7% |
Demographics Similar to Choctaw by Seniors Poverty Over the Age of 65
In terms of seniors poverty over the age of 65, the demographic groups most similar to Choctaw are Brazilian (11.3%, a difference of 0.14%), Immigrants from Western Asia (11.4%, a difference of 0.17%), Israeli (11.3%, a difference of 0.32%), Immigrants from Zaire (11.3%, a difference of 0.38%), and Costa Rican (11.3%, a difference of 0.39%).
| Demographics | Rating | Rank | Seniors Poverty Over the Age of 65 |
| Immigrants | Israel | 20.3 /100 | #199 | Fair 11.3% |
| Alsatians | 20.1 /100 | #200 | Fair 11.3% |
| Immigrants | Brazil | 17.8 /100 | #201 | Poor 11.3% |
| Costa Ricans | 17.0 /100 | #202 | Poor 11.3% |
| Immigrants | Zaire | 16.9 /100 | #203 | Poor 11.3% |
| Israelis | 16.5 /100 | #204 | Poor 11.3% |
| Brazilians | 15.4 /100 | #205 | Poor 11.3% |
| Choctaw | 14.5 /100 | #206 | Poor 11.4% |
| Immigrants | Western Asia | 13.6 /100 | #207 | Poor 11.4% |
| South American Indians | 11.7 /100 | #208 | Poor 11.4% |
| Paraguayans | 11.3 /100 | #209 | Poor 11.4% |
| Ugandans | 11.2 /100 | #210 | Poor 11.4% |
| Indonesians | 10.4 /100 | #211 | Poor 11.5% |
| Immigrants | China | 9.5 /100 | #212 | Tragic 11.5% |
| Nepalese | 8.9 /100 | #213 | Tragic 11.5% |