Immigrants from Panama vs Choctaw Seniors Poverty Over the Age of 65
COMPARE
Immigrants from Panama
Choctaw
Seniors Poverty Over the Age of 65
Seniors Poverty Over the Age of 65 Comparison
Immigrants from Panama
Choctaw
12.4%
SENIORS POVERTY OVER THE AGE OF 65
0.2/ 100
METRIC RATING
256th/ 347
METRIC RANK
11.4%
SENIORS POVERTY OVER THE AGE OF 65
14.5/ 100
METRIC RATING
206th/ 347
METRIC RANK
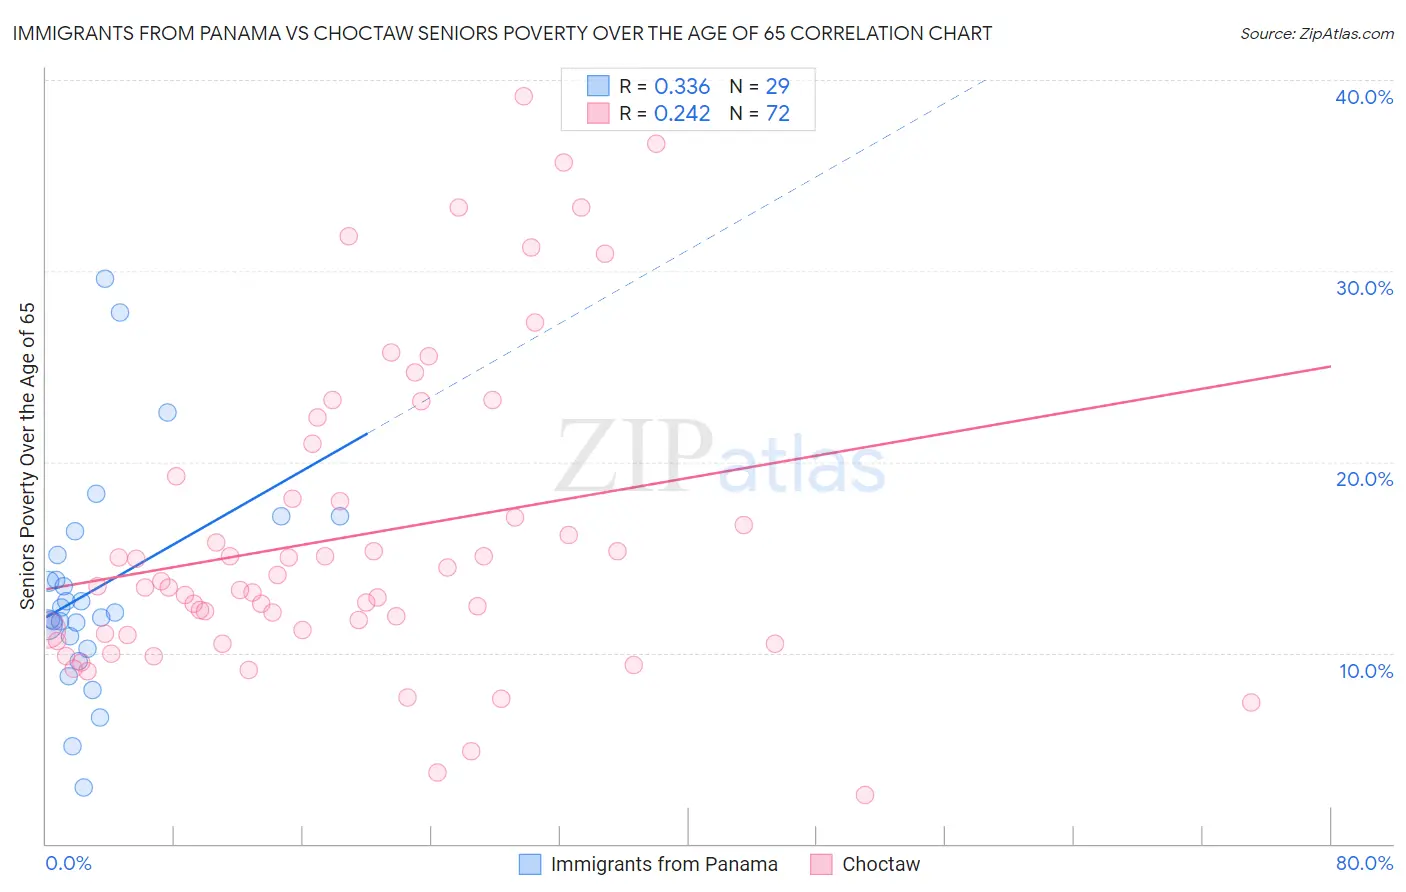
Immigrants from Panama vs Choctaw Seniors Poverty Over the Age of 65 Correlation Chart
The statistical analysis conducted on geographies consisting of 220,891,607 people shows a mild positive correlation between the proportion of Immigrants from Panama and poverty level among seniors over the age of 65 in the United States with a correlation coefficient (R) of 0.336 and weighted average of 12.4%. Similarly, the statistical analysis conducted on geographies consisting of 268,951,728 people shows a weak positive correlation between the proportion of Choctaw and poverty level among seniors over the age of 65 in the United States with a correlation coefficient (R) of 0.242 and weighted average of 11.4%, a difference of 9.2%.
Seniors Poverty Over the Age of 65 Correlation Summary
| Measurement | Immigrants from Panama | Choctaw |
| Minimum | 3.0% | 2.6% |
| Maximum | 29.6% | 39.1% |
| Range | 26.6% | 36.6% |
| Mean | 13.4% | 16.1% |
| Median | 12.1% | 13.5% |
| Interquartile 25% (IQ1) | 10.5% | 11.0% |
| Interquartile 75% (IQ3) | 15.8% | 18.7% |
| Interquartile Range (IQR) | 5.2% | 7.7% |
| Standard Deviation (Sample) | 5.8% | 8.1% |
| Standard Deviation (Population) | 5.7% | 8.1% |
Similar Demographics by Seniors Poverty Over the Age of 65
Demographics Similar to Immigrants from Panama by Seniors Poverty Over the Age of 65
In terms of seniors poverty over the age of 65, the demographic groups most similar to Immigrants from Panama are Immigrants (12.4%, a difference of 0.010%), Mexican American Indian (12.4%, a difference of 0.23%), Dutch West Indian (12.4%, a difference of 0.25%), Ghanaian (12.4%, a difference of 0.28%), and Immigrants from Cambodia (12.4%, a difference of 0.36%).
| Demographics | Rating | Rank | Seniors Poverty Over the Age of 65 |
| Ute | 0.6 /100 | #249 | Tragic 12.2% |
| Immigrants | Liberia | 0.5 /100 | #250 | Tragic 12.2% |
| Somalis | 0.3 /100 | #251 | Tragic 12.3% |
| Armenians | 0.3 /100 | #252 | Tragic 12.3% |
| Shoshone | 0.3 /100 | #253 | Tragic 12.3% |
| Immigrants | Cambodia | 0.3 /100 | #254 | Tragic 12.4% |
| Mexican American Indians | 0.3 /100 | #255 | Tragic 12.4% |
| Immigrants | Panama | 0.2 /100 | #256 | Tragic 12.4% |
| Immigrants | Immigrants | 0.2 /100 | #257 | Tragic 12.4% |
| Dutch West Indians | 0.2 /100 | #258 | Tragic 12.4% |
| Ghanaians | 0.2 /100 | #259 | Tragic 12.4% |
| South Americans | 0.2 /100 | #260 | Tragic 12.5% |
| Colombians | 0.2 /100 | #261 | Tragic 12.5% |
| Venezuelans | 0.1 /100 | #262 | Tragic 12.5% |
| Soviet Union | 0.1 /100 | #263 | Tragic 12.6% |
Demographics Similar to Choctaw by Seniors Poverty Over the Age of 65
In terms of seniors poverty over the age of 65, the demographic groups most similar to Choctaw are Brazilian (11.3%, a difference of 0.14%), Immigrants from Western Asia (11.4%, a difference of 0.17%), Israeli (11.3%, a difference of 0.32%), Immigrants from Zaire (11.3%, a difference of 0.38%), and Costa Rican (11.3%, a difference of 0.39%).
| Demographics | Rating | Rank | Seniors Poverty Over the Age of 65 |
| Immigrants | Israel | 20.3 /100 | #199 | Fair 11.3% |
| Alsatians | 20.1 /100 | #200 | Fair 11.3% |
| Immigrants | Brazil | 17.8 /100 | #201 | Poor 11.3% |
| Costa Ricans | 17.0 /100 | #202 | Poor 11.3% |
| Immigrants | Zaire | 16.9 /100 | #203 | Poor 11.3% |
| Israelis | 16.5 /100 | #204 | Poor 11.3% |
| Brazilians | 15.4 /100 | #205 | Poor 11.3% |
| Choctaw | 14.5 /100 | #206 | Poor 11.4% |
| Immigrants | Western Asia | 13.6 /100 | #207 | Poor 11.4% |
| South American Indians | 11.7 /100 | #208 | Poor 11.4% |
| Paraguayans | 11.3 /100 | #209 | Poor 11.4% |
| Ugandans | 11.2 /100 | #210 | Poor 11.4% |
| Indonesians | 10.4 /100 | #211 | Poor 11.5% |
| Immigrants | China | 9.5 /100 | #212 | Tragic 11.5% |
| Nepalese | 8.9 /100 | #213 | Tragic 11.5% |