Immigrants from Uganda vs Choctaw Seniors Poverty Over the Age of 65
COMPARE
Immigrants from Uganda
Choctaw
Seniors Poverty Over the Age of 65
Seniors Poverty Over the Age of 65 Comparison
Immigrants from Uganda
Choctaw
11.1%
SENIORS POVERTY OVER THE AGE OF 65
32.2/ 100
METRIC RATING
191st/ 347
METRIC RANK
11.4%
SENIORS POVERTY OVER THE AGE OF 65
14.5/ 100
METRIC RATING
206th/ 347
METRIC RANK
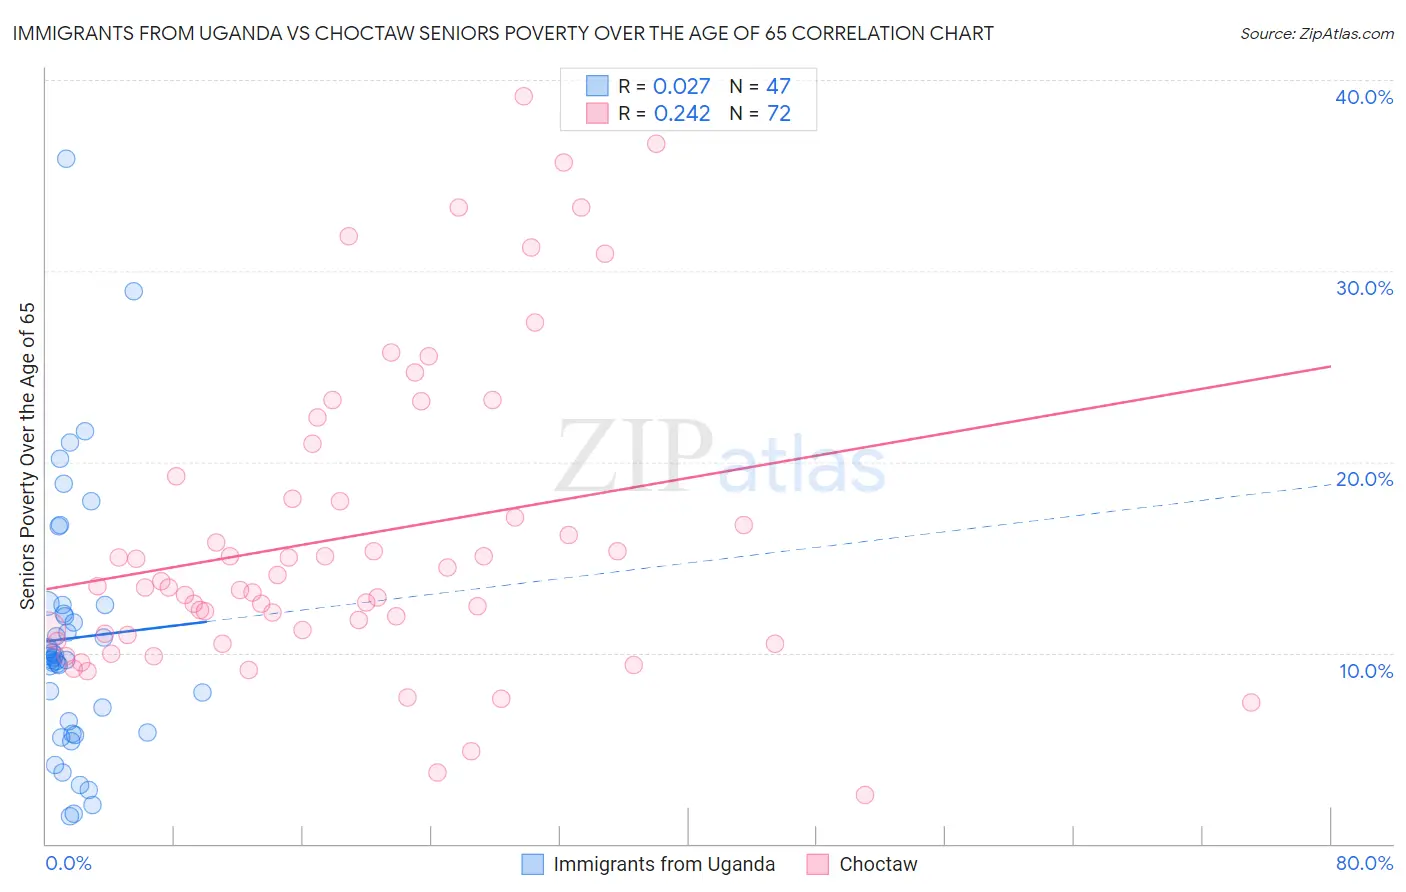
Immigrants from Uganda vs Choctaw Seniors Poverty Over the Age of 65 Correlation Chart
The statistical analysis conducted on geographies consisting of 125,911,000 people shows no correlation between the proportion of Immigrants from Uganda and poverty level among seniors over the age of 65 in the United States with a correlation coefficient (R) of 0.027 and weighted average of 11.1%. Similarly, the statistical analysis conducted on geographies consisting of 268,951,728 people shows a weak positive correlation between the proportion of Choctaw and poverty level among seniors over the age of 65 in the United States with a correlation coefficient (R) of 0.242 and weighted average of 11.4%, a difference of 2.2%.
Seniors Poverty Over the Age of 65 Correlation Summary
| Measurement | Immigrants from Uganda | Choctaw |
| Minimum | 1.4% | 2.6% |
| Maximum | 35.9% | 39.1% |
| Range | 34.5% | 36.6% |
| Mean | 10.8% | 16.1% |
| Median | 9.7% | 13.5% |
| Interquartile 25% (IQ1) | 5.8% | 11.0% |
| Interquartile 75% (IQ3) | 12.5% | 18.7% |
| Interquartile Range (IQR) | 6.7% | 7.7% |
| Standard Deviation (Sample) | 6.8% | 8.1% |
| Standard Deviation (Population) | 6.7% | 8.1% |
Demographics Similar to Immigrants from Uganda and Choctaw by Seniors Poverty Over the Age of 65
In terms of seniors poverty over the age of 65, the demographic groups most similar to Immigrants from Uganda are Indian (Asian) (11.1%, a difference of 0.20%), Immigrants from Southern Europe (11.1%, a difference of 0.22%), Taiwanese (11.2%, a difference of 0.30%), Immigrants from Laos (11.1%, a difference of 0.34%), and Immigrants from Hong Kong (11.1%, a difference of 0.40%). Similarly, the demographic groups most similar to Choctaw are Brazilian (11.3%, a difference of 0.14%), Immigrants from Western Asia (11.4%, a difference of 0.17%), Israeli (11.3%, a difference of 0.32%), Immigrants from Zaire (11.3%, a difference of 0.38%), and Costa Rican (11.3%, a difference of 0.39%).
| Demographics | Rating | Rank | Seniors Poverty Over the Age of 65 |
| Immigrants | Hong Kong | 36.3 /100 | #188 | Fair 11.1% |
| Immigrants | Laos | 35.7 /100 | #189 | Fair 11.1% |
| Indians (Asian) | 34.2 /100 | #190 | Fair 11.1% |
| Immigrants | Uganda | 32.2 /100 | #191 | Fair 11.1% |
| Immigrants | Southern Europe | 30.1 /100 | #192 | Fair 11.1% |
| Taiwanese | 29.2 /100 | #193 | Fair 11.2% |
| Chileans | 27.8 /100 | #194 | Fair 11.2% |
| Immigrants | Vietnam | 26.6 /100 | #195 | Fair 11.2% |
| Bangladeshis | 25.2 /100 | #196 | Fair 11.2% |
| Albanians | 24.4 /100 | #197 | Fair 11.2% |
| Immigrants | Burma/Myanmar | 21.3 /100 | #198 | Fair 11.3% |
| Immigrants | Israel | 20.3 /100 | #199 | Fair 11.3% |
| Alsatians | 20.1 /100 | #200 | Fair 11.3% |
| Immigrants | Brazil | 17.8 /100 | #201 | Poor 11.3% |
| Costa Ricans | 17.0 /100 | #202 | Poor 11.3% |
| Immigrants | Zaire | 16.9 /100 | #203 | Poor 11.3% |
| Israelis | 16.5 /100 | #204 | Poor 11.3% |
| Brazilians | 15.4 /100 | #205 | Poor 11.3% |
| Choctaw | 14.5 /100 | #206 | Poor 11.4% |
| Immigrants | Western Asia | 13.6 /100 | #207 | Poor 11.4% |
| South American Indians | 11.7 /100 | #208 | Poor 11.4% |