Asian vs Immigrants from Vietnam Single Mother Households
COMPARE
Asian
Immigrants from Vietnam
Single Mother Households
Single Mother Households Comparison
Asians
Immigrants from Vietnam
5.6%
SINGLE MOTHER HOUSEHOLDS
98.5/ 100
METRIC RATING
69th/ 347
METRIC RANK
6.3%
SINGLE MOTHER HOUSEHOLDS
51.5/ 100
METRIC RATING
173rd/ 347
METRIC RANK
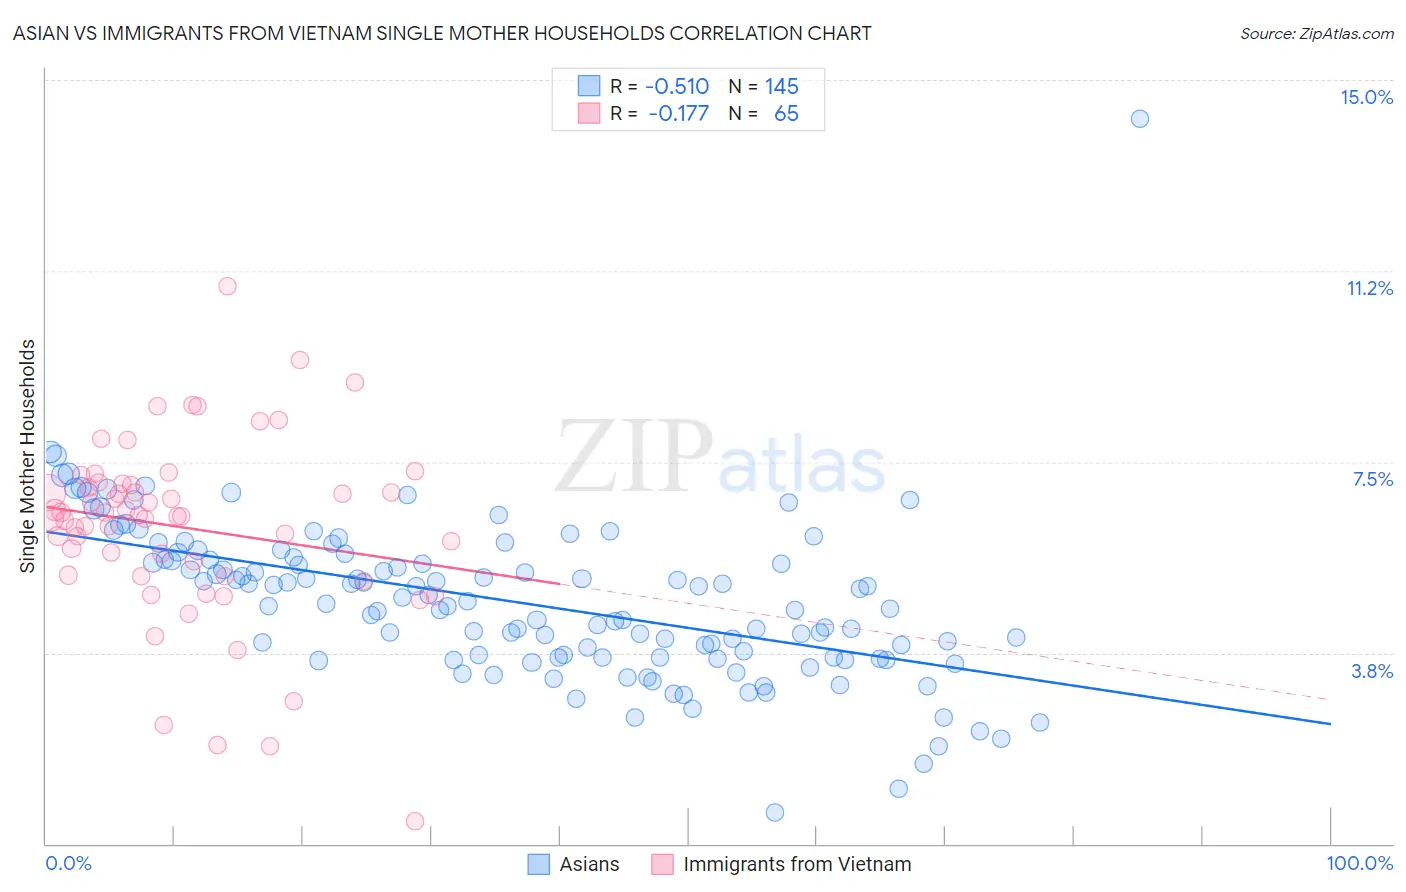
Asian vs Immigrants from Vietnam Single Mother Households Correlation Chart
The statistical analysis conducted on geographies consisting of 547,100,295 people shows a substantial negative correlation between the proportion of Asians and percentage of single mother households in the United States with a correlation coefficient (R) of -0.510 and weighted average of 5.6%. Similarly, the statistical analysis conducted on geographies consisting of 403,855,615 people shows a poor negative correlation between the proportion of Immigrants from Vietnam and percentage of single mother households in the United States with a correlation coefficient (R) of -0.177 and weighted average of 6.3%, a difference of 12.7%.
Single Mother Households Correlation Summary
| Measurement | Asian | Immigrants from Vietnam |
| Minimum | 0.61% | 0.45% |
| Maximum | 14.2% | 11.0% |
| Range | 13.6% | 10.5% |
| Mean | 4.7% | 6.2% |
| Median | 4.7% | 6.4% |
| Interquartile 25% (IQ1) | 3.7% | 5.3% |
| Interquartile 75% (IQ3) | 5.6% | 7.1% |
| Interquartile Range (IQR) | 1.9% | 1.8% |
| Standard Deviation (Sample) | 1.6% | 1.8% |
| Standard Deviation (Population) | 1.6% | 1.8% |
Similar Demographics by Single Mother Households
Demographics Similar to Asians by Single Mother Households
In terms of single mother households, the demographic groups most similar to Asians are Immigrants from Bulgaria (5.6%, a difference of 0.020%), Immigrants from Eastern Europe (5.6%, a difference of 0.080%), Immigrants from Kazakhstan (5.6%, a difference of 0.080%), Italian (5.6%, a difference of 0.090%), and Immigrants from Canada (5.6%, a difference of 0.11%).
| Demographics | Rating | Rank | Single Mother Households |
| Poles | 98.6 /100 | #62 | Exceptional 5.6% |
| Immigrants | North Macedonia | 98.6 /100 | #63 | Exceptional 5.6% |
| Immigrants | France | 98.6 /100 | #64 | Exceptional 5.6% |
| Greeks | 98.6 /100 | #65 | Exceptional 5.6% |
| Immigrants | Canada | 98.5 /100 | #66 | Exceptional 5.6% |
| Italians | 98.5 /100 | #67 | Exceptional 5.6% |
| Immigrants | Bulgaria | 98.5 /100 | #68 | Exceptional 5.6% |
| Asians | 98.5 /100 | #69 | Exceptional 5.6% |
| Immigrants | Eastern Europe | 98.4 /100 | #70 | Exceptional 5.6% |
| Immigrants | Kazakhstan | 98.4 /100 | #71 | Exceptional 5.6% |
| Immigrants | Netherlands | 98.4 /100 | #72 | Exceptional 5.6% |
| Immigrants | Asia | 98.4 /100 | #73 | Exceptional 5.6% |
| Immigrants | North America | 98.3 /100 | #74 | Exceptional 5.6% |
| Slovenes | 98.3 /100 | #75 | Exceptional 5.6% |
| New Zealanders | 98.2 /100 | #76 | Exceptional 5.6% |
Demographics Similar to Immigrants from Vietnam by Single Mother Households
In terms of single mother households, the demographic groups most similar to Immigrants from Vietnam are Immigrants from South Eastern Asia (6.3%, a difference of 0.070%), Afghan (6.3%, a difference of 0.11%), Immigrants from Morocco (6.3%, a difference of 0.17%), Immigrants from Oceania (6.3%, a difference of 0.34%), and Marshallese (6.3%, a difference of 0.63%).
| Demographics | Rating | Rank | Single Mother Households |
| Sri Lankans | 63.9 /100 | #166 | Good 6.2% |
| Brazilians | 59.1 /100 | #167 | Average 6.2% |
| Immigrants | Chile | 58.3 /100 | #168 | Average 6.3% |
| Puget Sound Salish | 58.1 /100 | #169 | Average 6.3% |
| Immigrants | Oceania | 54.6 /100 | #170 | Average 6.3% |
| Afghans | 52.5 /100 | #171 | Average 6.3% |
| Immigrants | South Eastern Asia | 52.2 /100 | #172 | Average 6.3% |
| Immigrants | Vietnam | 51.5 /100 | #173 | Average 6.3% |
| Immigrants | Morocco | 50.0 /100 | #174 | Average 6.3% |
| Marshallese | 45.8 /100 | #175 | Average 6.3% |
| Immigrants | Bosnia and Herzegovina | 44.3 /100 | #176 | Average 6.3% |
| Osage | 43.0 /100 | #177 | Average 6.4% |
| Portuguese | 40.0 /100 | #178 | Fair 6.4% |
| Hmong | 39.8 /100 | #179 | Fair 6.4% |
| Immigrants | Nepal | 36.1 /100 | #180 | Fair 6.4% |