Asian vs Immigrants from Morocco 5th Grade
COMPARE
Asian
Immigrants from Morocco
5th Grade
5th Grade Comparison
Asians
Immigrants from Morocco
96.9%
5TH GRADE
2.0/ 100
METRIC RATING
238th/ 347
METRIC RANK
97.1%
5TH GRADE
7.5/ 100
METRIC RATING
215th/ 347
METRIC RANK
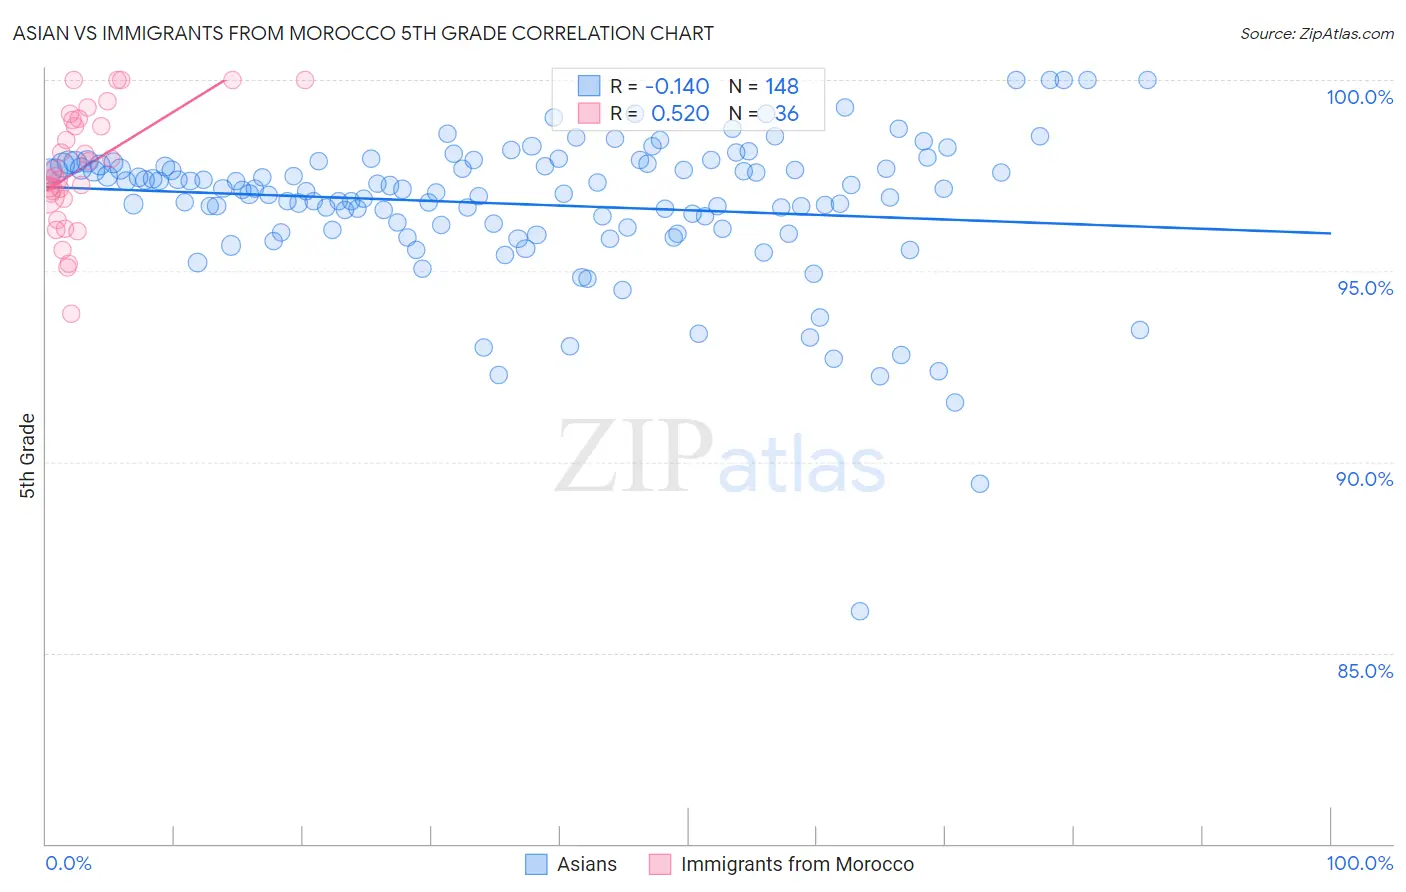
Asian vs Immigrants from Morocco 5th Grade Correlation Chart
The statistical analysis conducted on geographies consisting of 550,860,618 people shows a poor negative correlation between the proportion of Asians and percentage of population with at least 5th grade education in the United States with a correlation coefficient (R) of -0.140 and weighted average of 96.9%. Similarly, the statistical analysis conducted on geographies consisting of 178,910,634 people shows a substantial positive correlation between the proportion of Immigrants from Morocco and percentage of population with at least 5th grade education in the United States with a correlation coefficient (R) of 0.520 and weighted average of 97.1%, a difference of 0.14%.
5th Grade Correlation Summary
| Measurement | Asian | Immigrants from Morocco |
| Minimum | 86.1% | 93.9% |
| Maximum | 100.0% | 100.0% |
| Range | 13.9% | 6.1% |
| Mean | 96.7% | 97.7% |
| Median | 97.1% | 97.6% |
| Interquartile 25% (IQ1) | 96.1% | 96.9% |
| Interquartile 75% (IQ3) | 97.8% | 99.0% |
| Interquartile Range (IQR) | 1.7% | 2.0% |
| Standard Deviation (Sample) | 1.9% | 1.6% |
| Standard Deviation (Population) | 1.9% | 1.5% |
Similar Demographics by 5th Grade
Demographics Similar to Asians by 5th Grade
In terms of 5th grade, the demographic groups most similar to Asians are Immigrants from Indonesia (96.9%, a difference of 0.0%), Nigerian (96.9%, a difference of 0.0%), Indian (Asian) (96.9%, a difference of 0.0%), Immigrants from Asia (96.9%, a difference of 0.020%), and Immigrants from Costa Rica (96.9%, a difference of 0.020%).
| Demographics | Rating | Rank | 5th Grade |
| Immigrants | Malaysia | 4.1 /100 | #231 | Tragic 97.0% |
| Immigrants | Eastern Asia | 4.0 /100 | #232 | Tragic 97.0% |
| Sub-Saharan Africans | 3.3 /100 | #233 | Tragic 97.0% |
| Tohono O'odham | 3.2 /100 | #234 | Tragic 97.0% |
| Uruguayans | 3.2 /100 | #235 | Tragic 97.0% |
| Senegalese | 2.8 /100 | #236 | Tragic 97.0% |
| Immigrants | Indonesia | 2.0 /100 | #237 | Tragic 96.9% |
| Asians | 2.0 /100 | #238 | Tragic 96.9% |
| Nigerians | 1.9 /100 | #239 | Tragic 96.9% |
| Indians (Asian) | 1.9 /100 | #240 | Tragic 96.9% |
| Immigrants | Asia | 1.7 /100 | #241 | Tragic 96.9% |
| Immigrants | Costa Rica | 1.6 /100 | #242 | Tragic 96.9% |
| Immigrants | Eastern Africa | 1.6 /100 | #243 | Tragic 96.9% |
| Koreans | 1.6 /100 | #244 | Tragic 96.9% |
| Colombians | 1.3 /100 | #245 | Tragic 96.9% |
Demographics Similar to Immigrants from Morocco by 5th Grade
In terms of 5th grade, the demographic groups most similar to Immigrants from Morocco are Portuguese (97.1%, a difference of 0.0%), Costa Rican (97.1%, a difference of 0.0%), Samoan (97.1%, a difference of 0.010%), Immigrants from Iraq (97.1%, a difference of 0.010%), and Sudanese (97.1%, a difference of 0.010%).
| Demographics | Rating | Rank | 5th Grade |
| Laotians | 10.8 /100 | #208 | Poor 97.1% |
| Immigrants | Nepal | 10.3 /100 | #209 | Poor 97.1% |
| Immigrants | Oceania | 10.0 /100 | #210 | Poor 97.1% |
| Samoans | 8.5 /100 | #211 | Tragic 97.1% |
| Immigrants | Iraq | 8.3 /100 | #212 | Tragic 97.1% |
| Portuguese | 7.8 /100 | #213 | Tragic 97.1% |
| Costa Ricans | 7.7 /100 | #214 | Tragic 97.1% |
| Immigrants | Morocco | 7.5 /100 | #215 | Tragic 97.1% |
| Sudanese | 7.0 /100 | #216 | Tragic 97.1% |
| Immigrants | Lebanon | 6.8 /100 | #217 | Tragic 97.1% |
| Immigrants | Sudan | 6.5 /100 | #218 | Tragic 97.1% |
| Immigrants | Syria | 6.4 /100 | #219 | Tragic 97.1% |
| Immigrants | Southern Europe | 6.3 /100 | #220 | Tragic 97.1% |
| Sierra Leoneans | 6.0 /100 | #221 | Tragic 97.1% |
| Immigrants | Panama | 5.7 /100 | #222 | Tragic 97.0% |