Immigrants from Cameroon vs Immigrants from Morocco Female Poverty
COMPARE
Immigrants from Cameroon
Immigrants from Morocco
Female Poverty
Female Poverty Comparison
Immigrants from Cameroon
Immigrants from Morocco
13.5%
FEMALE POVERTY
42.0/ 100
METRIC RATING
185th/ 347
METRIC RANK
13.4%
FEMALE POVERTY
49.4/ 100
METRIC RATING
177th/ 347
METRIC RANK
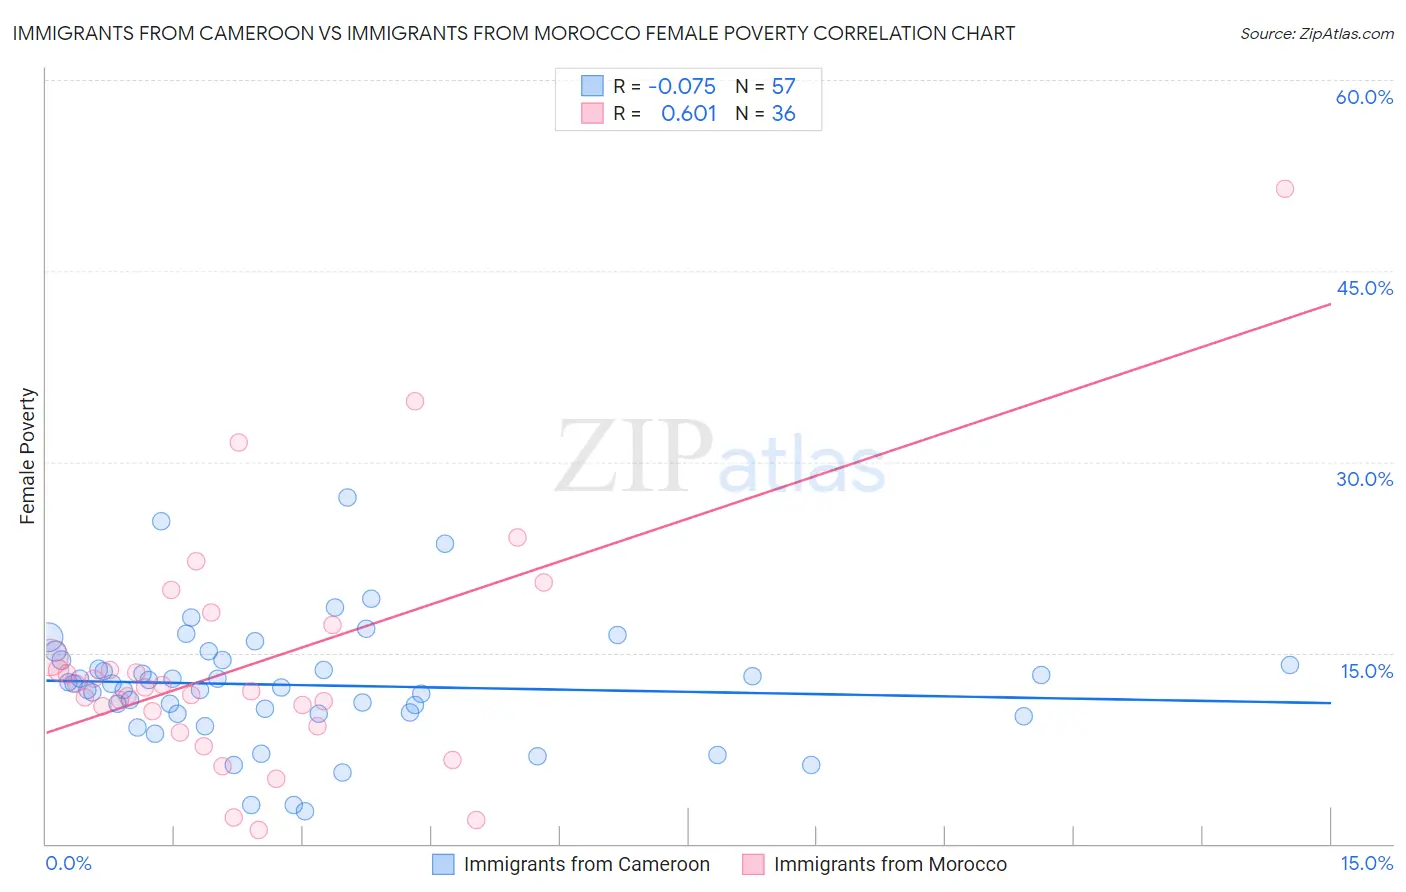
Immigrants from Cameroon vs Immigrants from Morocco Female Poverty Correlation Chart
The statistical analysis conducted on geographies consisting of 130,715,237 people shows a slight negative correlation between the proportion of Immigrants from Cameroon and poverty level among females in the United States with a correlation coefficient (R) of -0.075 and weighted average of 13.5%. Similarly, the statistical analysis conducted on geographies consisting of 178,904,508 people shows a significant positive correlation between the proportion of Immigrants from Morocco and poverty level among females in the United States with a correlation coefficient (R) of 0.601 and weighted average of 13.4%, a difference of 0.72%.
Female Poverty Correlation Summary
| Measurement | Immigrants from Cameroon | Immigrants from Morocco |
| Minimum | 2.6% | 1.1% |
| Maximum | 27.2% | 51.5% |
| Range | 24.6% | 50.4% |
| Mean | 12.5% | 14.1% |
| Median | 12.5% | 12.1% |
| Interquartile 25% (IQ1) | 10.2% | 9.8% |
| Interquartile 75% (IQ3) | 14.4% | 15.9% |
| Interquartile Range (IQR) | 4.2% | 6.1% |
| Standard Deviation (Sample) | 4.8% | 9.6% |
| Standard Deviation (Population) | 4.8% | 9.5% |
Demographics Similar to Immigrants from Cameroon and Immigrants from Morocco by Female Poverty
In terms of female poverty, the demographic groups most similar to Immigrants from Cameroon are Immigrants from Portugal (13.6%, a difference of 0.060%), Immigrants from Sierra Leone (13.5%, a difference of 0.11%), Immigrants from Venezuela (13.6%, a difference of 0.11%), Kenyan (13.5%, a difference of 0.17%), and Hawaiian (13.6%, a difference of 0.21%). Similarly, the demographic groups most similar to Immigrants from Morocco are Israeli (13.5%, a difference of 0.030%), Immigrants from Spain (13.4%, a difference of 0.040%), Celtic (13.4%, a difference of 0.050%), Immigrants from Iraq (13.4%, a difference of 0.060%), and Immigrants from Syria (13.5%, a difference of 0.060%).
| Demographics | Rating | Rank | Female Poverty |
| Whites/Caucasians | 54.6 /100 | #171 | Average 13.4% |
| Mongolians | 53.6 /100 | #172 | Average 13.4% |
| Immigrants | Afghanistan | 50.8 /100 | #173 | Average 13.4% |
| Immigrants | Iraq | 50.0 /100 | #174 | Average 13.4% |
| Celtics | 49.9 /100 | #175 | Average 13.4% |
| Immigrants | Spain | 49.9 /100 | #176 | Average 13.4% |
| Immigrants | Morocco | 49.4 /100 | #177 | Average 13.4% |
| Israelis | 49.1 /100 | #178 | Average 13.5% |
| Immigrants | Syria | 48.8 /100 | #179 | Average 13.5% |
| South Americans | 44.8 /100 | #180 | Average 13.5% |
| Venezuelans | 44.5 /100 | #181 | Average 13.5% |
| Immigrants | Colombia | 44.5 /100 | #182 | Average 13.5% |
| Kenyans | 43.8 /100 | #183 | Average 13.5% |
| Immigrants | Sierra Leone | 43.2 /100 | #184 | Average 13.5% |
| Immigrants | Cameroon | 42.0 /100 | #185 | Average 13.5% |
| Immigrants | Portugal | 41.5 /100 | #186 | Average 13.6% |
| Immigrants | Venezuela | 41.0 /100 | #187 | Average 13.6% |
| Hawaiians | 39.9 /100 | #188 | Fair 13.6% |
| Uruguayans | 39.8 /100 | #189 | Fair 13.6% |
| Sierra Leoneans | 33.1 /100 | #190 | Fair 13.7% |
| Immigrants | Kuwait | 32.7 /100 | #191 | Fair 13.7% |