Immigrants from Middle Africa vs Immigrants from Hong Kong Child Poverty Under the Age of 5
COMPARE
Immigrants from Middle Africa
Immigrants from Hong Kong
Child Poverty Under the Age of 5
Child Poverty Under the Age of 5 Comparison
Immigrants from Middle Africa
Immigrants from Hong Kong
19.7%
CHILD POVERTY UNDER THE AGE OF 5
0.4/ 100
METRIC RATING
249th/ 347
METRIC RANK
12.4%
CHILD POVERTY UNDER THE AGE OF 5
100.0/ 100
METRIC RATING
5th/ 347
METRIC RANK
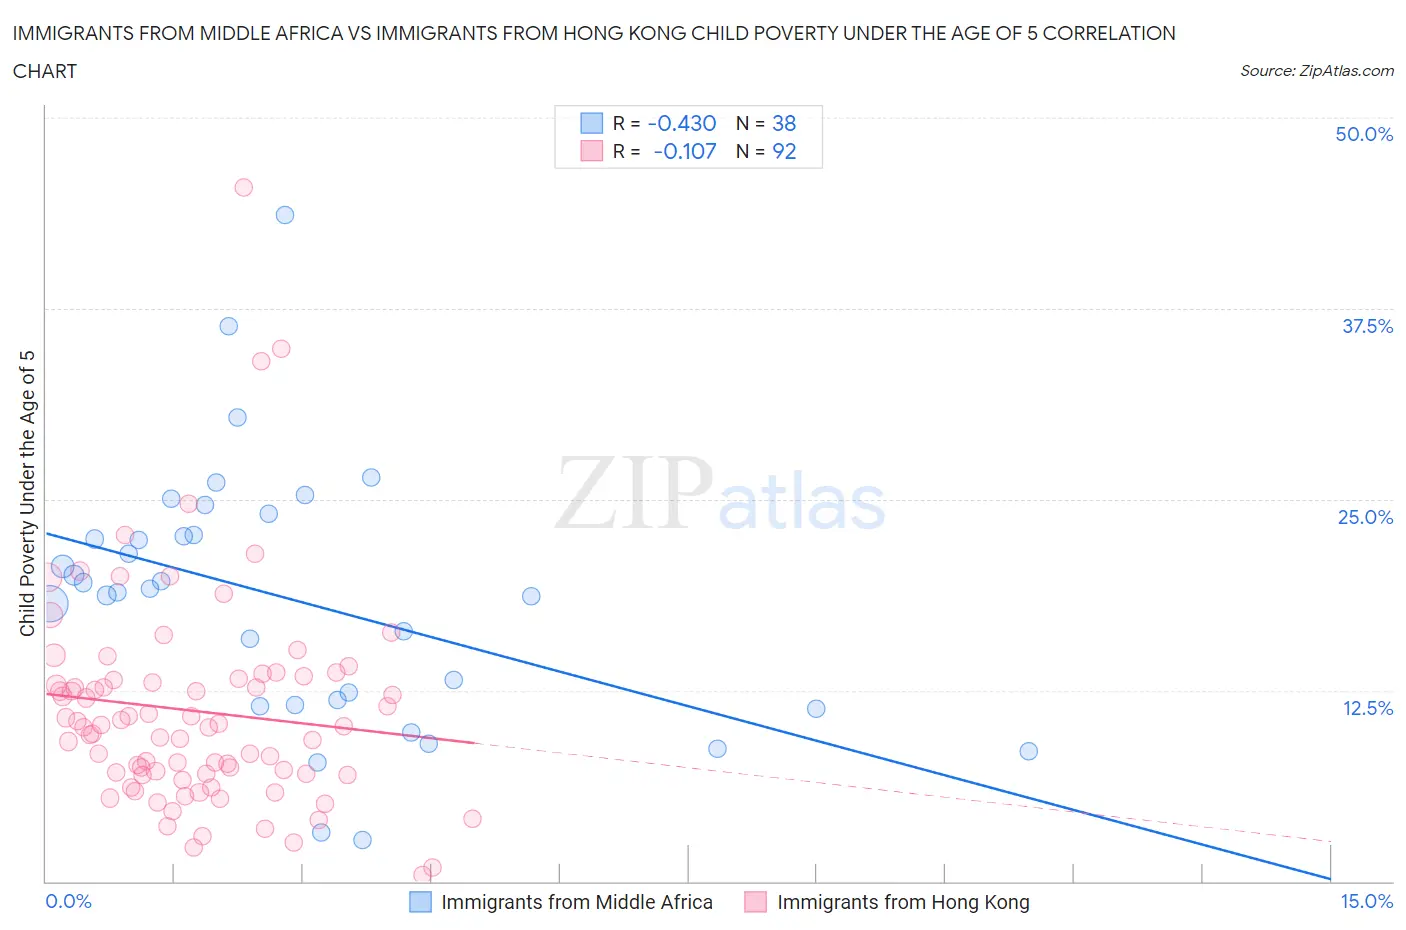
Immigrants from Middle Africa vs Immigrants from Hong Kong Child Poverty Under the Age of 5 Correlation Chart
The statistical analysis conducted on geographies consisting of 199,457,822 people shows a moderate negative correlation between the proportion of Immigrants from Middle Africa and poverty level among children under the age of 5 in the United States with a correlation coefficient (R) of -0.430 and weighted average of 19.7%. Similarly, the statistical analysis conducted on geographies consisting of 244,450,571 people shows a poor negative correlation between the proportion of Immigrants from Hong Kong and poverty level among children under the age of 5 in the United States with a correlation coefficient (R) of -0.107 and weighted average of 12.4%, a difference of 58.7%.
Child Poverty Under the Age of 5 Correlation Summary
| Measurement | Immigrants from Middle Africa | Immigrants from Hong Kong |
| Minimum | 2.7% | 0.42% |
| Maximum | 43.6% | 45.5% |
| Range | 40.9% | 45.0% |
| Mean | 18.4% | 11.1% |
| Median | 19.0% | 10.1% |
| Interquartile 25% (IQ1) | 11.6% | 7.0% |
| Interquartile 75% (IQ3) | 22.6% | 13.2% |
| Interquartile Range (IQR) | 11.1% | 6.2% |
| Standard Deviation (Sample) | 8.5% | 7.1% |
| Standard Deviation (Population) | 8.4% | 7.0% |
Similar Demographics by Child Poverty Under the Age of 5
Demographics Similar to Immigrants from Middle Africa by Child Poverty Under the Age of 5
In terms of child poverty under the age of 5, the demographic groups most similar to Immigrants from Middle Africa are Marshallese (19.7%, a difference of 0.020%), Guyanese (19.7%, a difference of 0.030%), Nonimmigrants (19.7%, a difference of 0.050%), Cree (19.7%, a difference of 0.19%), and Pennsylvania German (19.8%, a difference of 0.22%).
| Demographics | Rating | Rank | Child Poverty Under the Age of 5 |
| Immigrants | Guyana | 0.5 /100 | #242 | Tragic 19.6% |
| Osage | 0.5 /100 | #243 | Tragic 19.6% |
| Immigrants | Ghana | 0.5 /100 | #244 | Tragic 19.6% |
| Immigrants | Western Africa | 0.4 /100 | #245 | Tragic 19.7% |
| Cree | 0.4 /100 | #246 | Tragic 19.7% |
| Guyanese | 0.4 /100 | #247 | Tragic 19.7% |
| Marshallese | 0.4 /100 | #248 | Tragic 19.7% |
| Immigrants | Middle Africa | 0.4 /100 | #249 | Tragic 19.7% |
| Immigrants | Nonimmigrants | 0.4 /100 | #250 | Tragic 19.7% |
| Pennsylvania Germans | 0.3 /100 | #251 | Tragic 19.8% |
| Immigrants | Nicaragua | 0.3 /100 | #252 | Tragic 19.8% |
| Mexican American Indians | 0.3 /100 | #253 | Tragic 19.9% |
| Fijians | 0.3 /100 | #254 | Tragic 19.9% |
| Immigrants | Cuba | 0.2 /100 | #255 | Tragic 19.9% |
| Immigrants | Barbados | 0.2 /100 | #256 | Tragic 20.0% |
Demographics Similar to Immigrants from Hong Kong by Child Poverty Under the Age of 5
In terms of child poverty under the age of 5, the demographic groups most similar to Immigrants from Hong Kong are Thai (12.3%, a difference of 1.0%), Immigrants from Singapore (12.9%, a difference of 4.0%), Chinese (13.1%, a difference of 5.1%), Iranian (13.1%, a difference of 5.1%), and Immigrants from Iran (13.1%, a difference of 5.2%).
| Demographics | Rating | Rank | Child Poverty Under the Age of 5 |
| Immigrants | India | 100.0 /100 | #1 | Exceptional 11.5% |
| Immigrants | Taiwan | 100.0 /100 | #2 | Exceptional 11.6% |
| Filipinos | 100.0 /100 | #3 | Exceptional 11.6% |
| Thais | 100.0 /100 | #4 | Exceptional 12.3% |
| Immigrants | Hong Kong | 100.0 /100 | #5 | Exceptional 12.4% |
| Immigrants | Singapore | 100.0 /100 | #6 | Exceptional 12.9% |
| Chinese | 100.0 /100 | #7 | Exceptional 13.1% |
| Iranians | 100.0 /100 | #8 | Exceptional 13.1% |
| Immigrants | Iran | 100.0 /100 | #9 | Exceptional 13.1% |
| Burmese | 100.0 /100 | #10 | Exceptional 13.2% |
| Immigrants | Korea | 100.0 /100 | #11 | Exceptional 13.2% |
| Immigrants | South Central Asia | 100.0 /100 | #12 | Exceptional 13.3% |
| Bhutanese | 100.0 /100 | #13 | Exceptional 13.4% |
| Okinawans | 100.0 /100 | #14 | Exceptional 13.4% |
| Indians (Asian) | 100.0 /100 | #15 | Exceptional 13.4% |