Asian vs Immigrants from Hong Kong Householder Income Over 65 years
COMPARE
Asian
Immigrants from Hong Kong
Householder Income Over 65 years
Householder Income Over 65 years Comparison
Asians
Immigrants from Hong Kong
$68,822
HOUSEHOLDER INCOME OVER 65 YEARS
100.0/ 100
METRIC RATING
32nd/ 347
METRIC RANK
$71,567
HOUSEHOLDER INCOME OVER 65 YEARS
100.0/ 100
METRIC RATING
13th/ 347
METRIC RANK
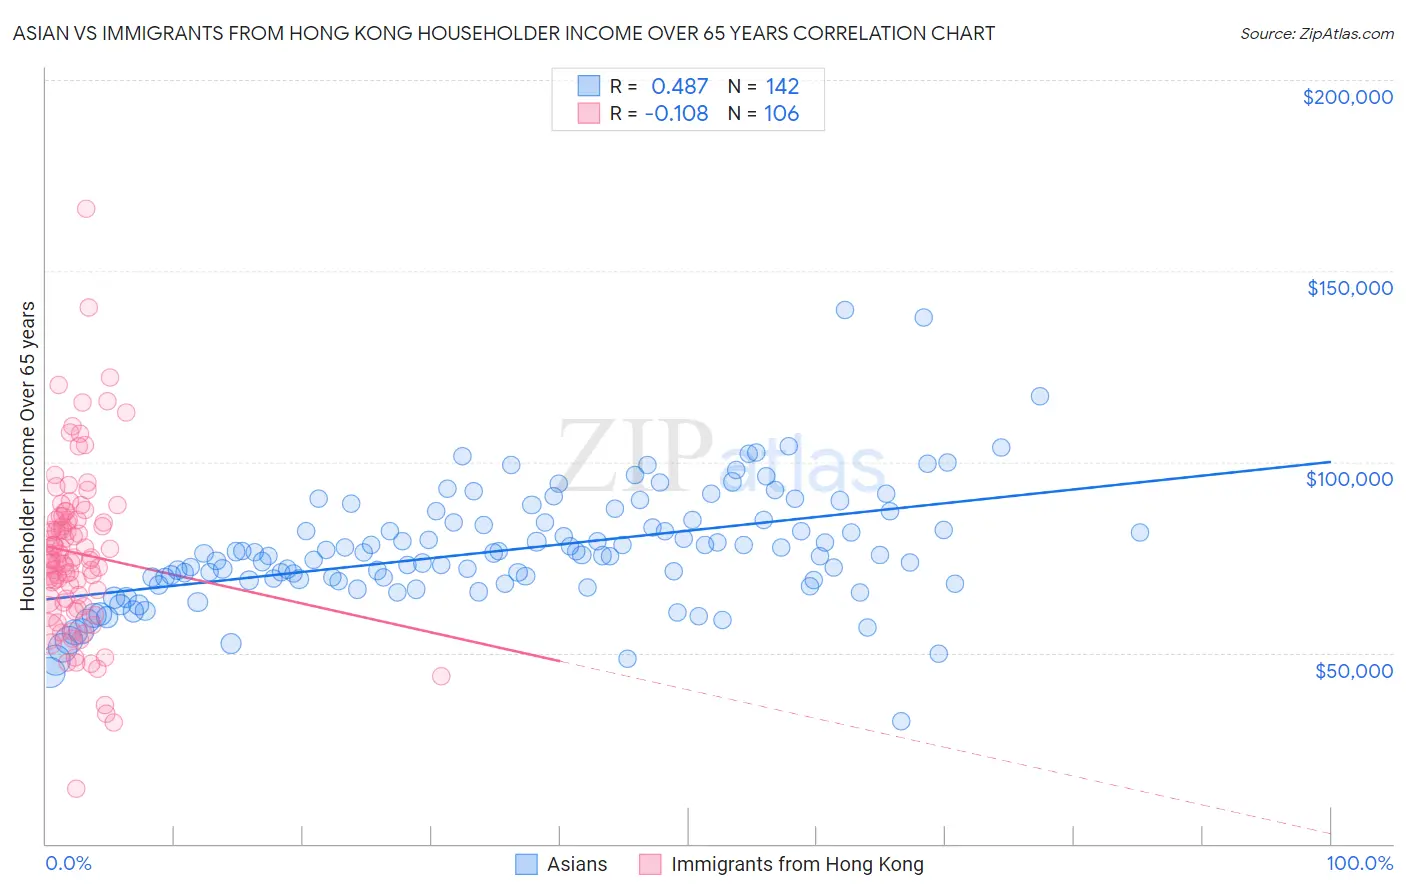
Asian vs Immigrants from Hong Kong Householder Income Over 65 years Correlation Chart
The statistical analysis conducted on geographies consisting of 546,636,612 people shows a moderate positive correlation between the proportion of Asians and household income with householder over the age of 65 in the United States with a correlation coefficient (R) of 0.487 and weighted average of $68,822. Similarly, the statistical analysis conducted on geographies consisting of 253,485,183 people shows a poor negative correlation between the proportion of Immigrants from Hong Kong and household income with householder over the age of 65 in the United States with a correlation coefficient (R) of -0.108 and weighted average of $71,567, a difference of 4.0%.
Householder Income Over 65 years Correlation Summary
| Measurement | Asian | Immigrants from Hong Kong |
| Minimum | $32,121 | $14,323 |
| Maximum | $139,689 | $166,250 |
| Range | $107,568 | $151,927 |
| Mean | $76,866 | $76,158 |
| Median | $75,680 | $74,716 |
| Interquartile 25% (IQ1) | $68,749 | $63,807 |
| Interquartile 75% (IQ3) | $84,063 | $84,771 |
| Interquartile Range (IQR) | $15,314 | $20,964 |
| Standard Deviation (Sample) | $15,572 | $21,933 |
| Standard Deviation (Population) | $15,517 | $21,829 |
Demographics Similar to Asians and Immigrants from Hong Kong by Householder Income Over 65 years
In terms of householder income over 65 years, the demographic groups most similar to Asians are Afghan ($68,951, a difference of 0.19%), Immigrants from Northern Europe ($69,003, a difference of 0.26%), Immigrants from Australia ($69,164, a difference of 0.50%), Immigrants from China ($69,174, a difference of 0.51%), and Immigrants from Switzerland ($69,343, a difference of 0.76%). Similarly, the demographic groups most similar to Immigrants from Hong Kong are Cypriot ($71,714, a difference of 0.20%), Burmese ($71,139, a difference of 0.60%), Native Hawaiian ($71,021, a difference of 0.77%), Okinawan ($70,846, a difference of 1.0%), and Immigrants from Korea ($70,696, a difference of 1.2%).
| Demographics | Rating | Rank | Householder Income Over 65 years |
| Cypriots | 100.0 /100 | #12 | Exceptional $71,714 |
| Immigrants | Hong Kong | 100.0 /100 | #13 | Exceptional $71,567 |
| Burmese | 100.0 /100 | #14 | Exceptional $71,139 |
| Native Hawaiians | 100.0 /100 | #15 | Exceptional $71,021 |
| Okinawans | 100.0 /100 | #16 | Exceptional $70,846 |
| Immigrants | Korea | 100.0 /100 | #17 | Exceptional $70,696 |
| Eastern Europeans | 100.0 /100 | #18 | Exceptional $70,470 |
| Indians (Asian) | 100.0 /100 | #19 | Exceptional $70,238 |
| Immigrants | South Central Asia | 100.0 /100 | #20 | Exceptional $70,103 |
| Immigrants | Eastern Asia | 100.0 /100 | #21 | Exceptional $69,872 |
| Immigrants | Israel | 100.0 /100 | #22 | Exceptional $69,857 |
| Immigrants | Japan | 100.0 /100 | #23 | Exceptional $69,774 |
| Immigrants | Sweden | 100.0 /100 | #24 | Exceptional $69,722 |
| Immigrants | Belgium | 100.0 /100 | #25 | Exceptional $69,703 |
| Immigrants | Sri Lanka | 100.0 /100 | #26 | Exceptional $69,426 |
| Immigrants | Switzerland | 100.0 /100 | #27 | Exceptional $69,343 |
| Immigrants | China | 100.0 /100 | #28 | Exceptional $69,174 |
| Immigrants | Australia | 100.0 /100 | #29 | Exceptional $69,164 |
| Immigrants | Northern Europe | 100.0 /100 | #30 | Exceptional $69,003 |
| Afghans | 100.0 /100 | #31 | Exceptional $68,951 |
| Asians | 100.0 /100 | #32 | Exceptional $68,822 |