Asian vs Immigrants from Cambodia Child Poverty Among Girls Under 16
COMPARE
Asian
Immigrants from Cambodia
Child Poverty Among Girls Under 16
Child Poverty Among Girls Under 16 Comparison
Asians
Immigrants from Cambodia
13.7%
CHILD POVERTY AMONG GIRLS UNDER 16
99.7/ 100
METRIC RATING
30th/ 347
METRIC RANK
18.1%
CHILD POVERTY AMONG GIRLS UNDER 16
2.9/ 100
METRIC RATING
222nd/ 347
METRIC RANK
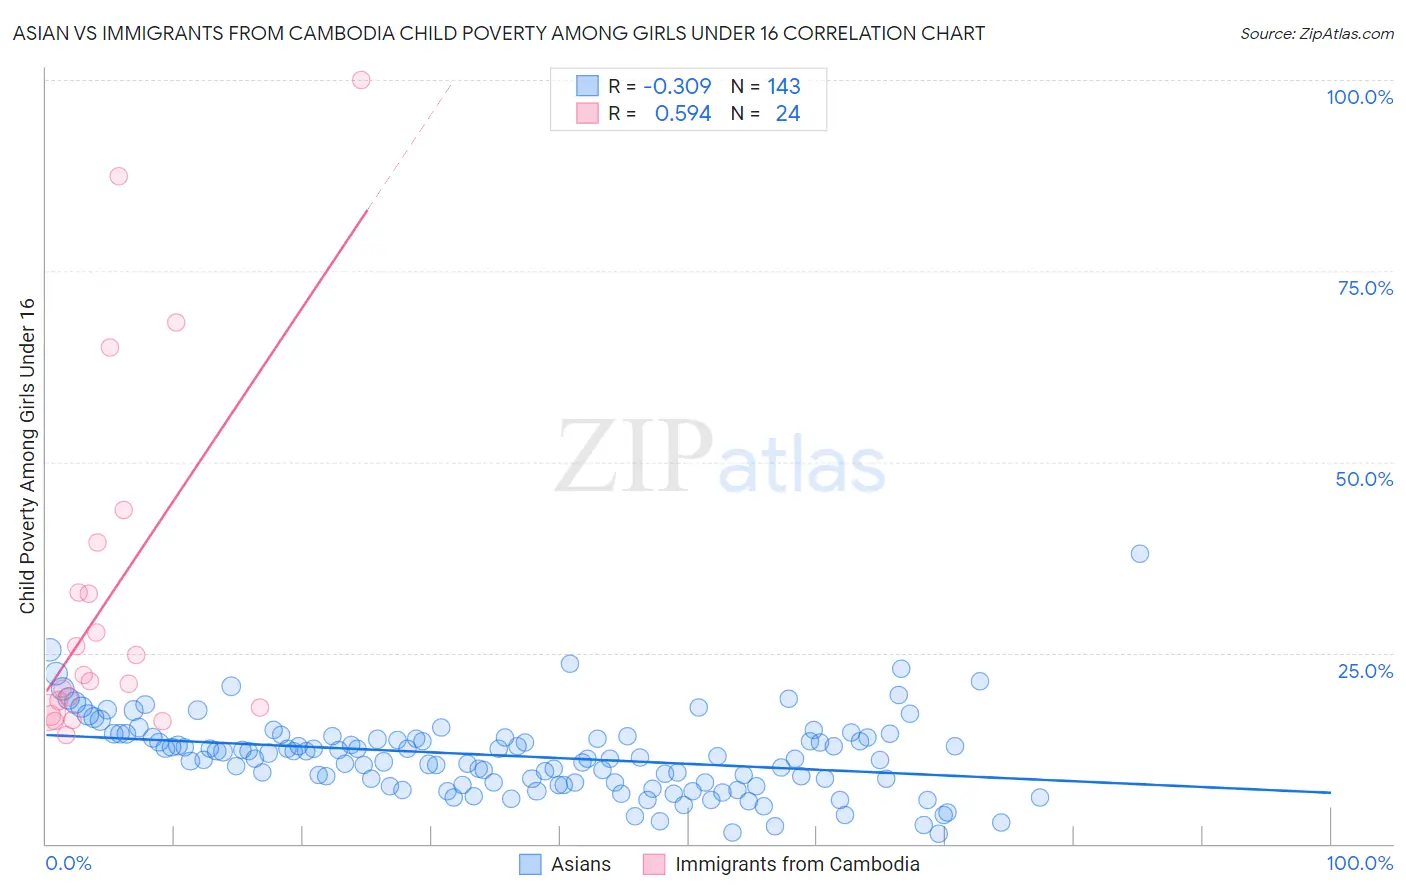
Asian vs Immigrants from Cambodia Child Poverty Among Girls Under 16 Correlation Chart
The statistical analysis conducted on geographies consisting of 532,137,785 people shows a mild negative correlation between the proportion of Asians and poverty level among girls under the age of 16 in the United States with a correlation coefficient (R) of -0.309 and weighted average of 13.7%. Similarly, the statistical analysis conducted on geographies consisting of 204,042,546 people shows a substantial positive correlation between the proportion of Immigrants from Cambodia and poverty level among girls under the age of 16 in the United States with a correlation coefficient (R) of 0.594 and weighted average of 18.1%, a difference of 32.6%.
Child Poverty Among Girls Under 16 Correlation Summary
| Measurement | Asian | Immigrants from Cambodia |
| Minimum | 1.3% | 14.3% |
| Maximum | 38.0% | 100.0% |
| Range | 36.7% | 85.7% |
| Mean | 11.5% | 32.7% |
| Median | 11.4% | 21.7% |
| Interquartile 25% (IQ1) | 8.0% | 17.4% |
| Interquartile 75% (IQ3) | 13.9% | 36.1% |
| Interquartile Range (IQR) | 5.9% | 18.7% |
| Standard Deviation (Sample) | 5.2% | 23.7% |
| Standard Deviation (Population) | 5.2% | 23.2% |
Similar Demographics by Child Poverty Among Girls Under 16
Demographics Similar to Asians by Child Poverty Among Girls Under 16
In terms of child poverty among girls under 16, the demographic groups most similar to Asians are Turkish (13.7%, a difference of 0.12%), Danish (13.7%, a difference of 0.16%), Swedish (13.7%, a difference of 0.19%), Maltese (13.7%, a difference of 0.24%), and Bolivian (13.6%, a difference of 0.67%).
| Demographics | Rating | Rank | Child Poverty Among Girls Under 16 |
| Norwegians | 99.9 /100 | #23 | Exceptional 13.3% |
| Immigrants | Eastern Asia | 99.9 /100 | #24 | Exceptional 13.4% |
| Immigrants | China | 99.8 /100 | #25 | Exceptional 13.4% |
| Eastern Europeans | 99.8 /100 | #26 | Exceptional 13.5% |
| Latvians | 99.8 /100 | #27 | Exceptional 13.5% |
| Tongans | 99.8 /100 | #28 | Exceptional 13.6% |
| Bolivians | 99.8 /100 | #29 | Exceptional 13.6% |
| Asians | 99.7 /100 | #30 | Exceptional 13.7% |
| Turks | 99.7 /100 | #31 | Exceptional 13.7% |
| Danes | 99.7 /100 | #32 | Exceptional 13.7% |
| Swedes | 99.7 /100 | #33 | Exceptional 13.7% |
| Maltese | 99.7 /100 | #34 | Exceptional 13.7% |
| Immigrants | Northern Europe | 99.6 /100 | #35 | Exceptional 13.8% |
| Russians | 99.6 /100 | #36 | Exceptional 13.9% |
| Lithuanians | 99.6 /100 | #37 | Exceptional 13.9% |
Demographics Similar to Immigrants from Cambodia by Child Poverty Among Girls Under 16
In terms of child poverty among girls under 16, the demographic groups most similar to Immigrants from Cambodia are Immigrants from Armenia (18.1%, a difference of 0.0%), Bermudan (18.1%, a difference of 0.080%), Immigrants from Africa (18.2%, a difference of 0.17%), Nicaraguan (18.2%, a difference of 0.50%), and Immigrants from Micronesia (18.0%, a difference of 0.52%).
| Demographics | Rating | Rank | Child Poverty Among Girls Under 16 |
| German Russians | 5.7 /100 | #215 | Tragic 17.8% |
| Moroccans | 5.5 /100 | #216 | Tragic 17.8% |
| Japanese | 5.3 /100 | #217 | Tragic 17.8% |
| Alaska Natives | 5.2 /100 | #218 | Tragic 17.8% |
| Immigrants | Panama | 4.7 /100 | #219 | Tragic 17.9% |
| Cubans | 4.1 /100 | #220 | Tragic 18.0% |
| Immigrants | Micronesia | 3.5 /100 | #221 | Tragic 18.0% |
| Immigrants | Cambodia | 2.9 /100 | #222 | Tragic 18.1% |
| Immigrants | Armenia | 2.9 /100 | #223 | Tragic 18.1% |
| Bermudans | 2.8 /100 | #224 | Tragic 18.1% |
| Immigrants | Africa | 2.7 /100 | #225 | Tragic 18.2% |
| Nicaraguans | 2.4 /100 | #226 | Tragic 18.2% |
| Immigrants | Nonimmigrants | 2.0 /100 | #227 | Tragic 18.3% |
| Alaskan Athabascans | 2.0 /100 | #228 | Tragic 18.3% |
| Ghanaians | 1.4 /100 | #229 | Tragic 18.5% |