Subsaharan African vs Hispanic or Latino Single Mother Poverty
COMPARE
Subsaharan African
Hispanic or Latino
Single Mother Poverty
Single Mother Poverty Comparison
Sub-Saharan Africans
Hispanics or Latinos
31.4%
SINGLE MOTHER POVERTY
0.2/ 100
METRIC RATING
266th/ 347
METRIC RANK
33.3%
SINGLE MOTHER POVERTY
0.0/ 100
METRIC RATING
300th/ 347
METRIC RANK
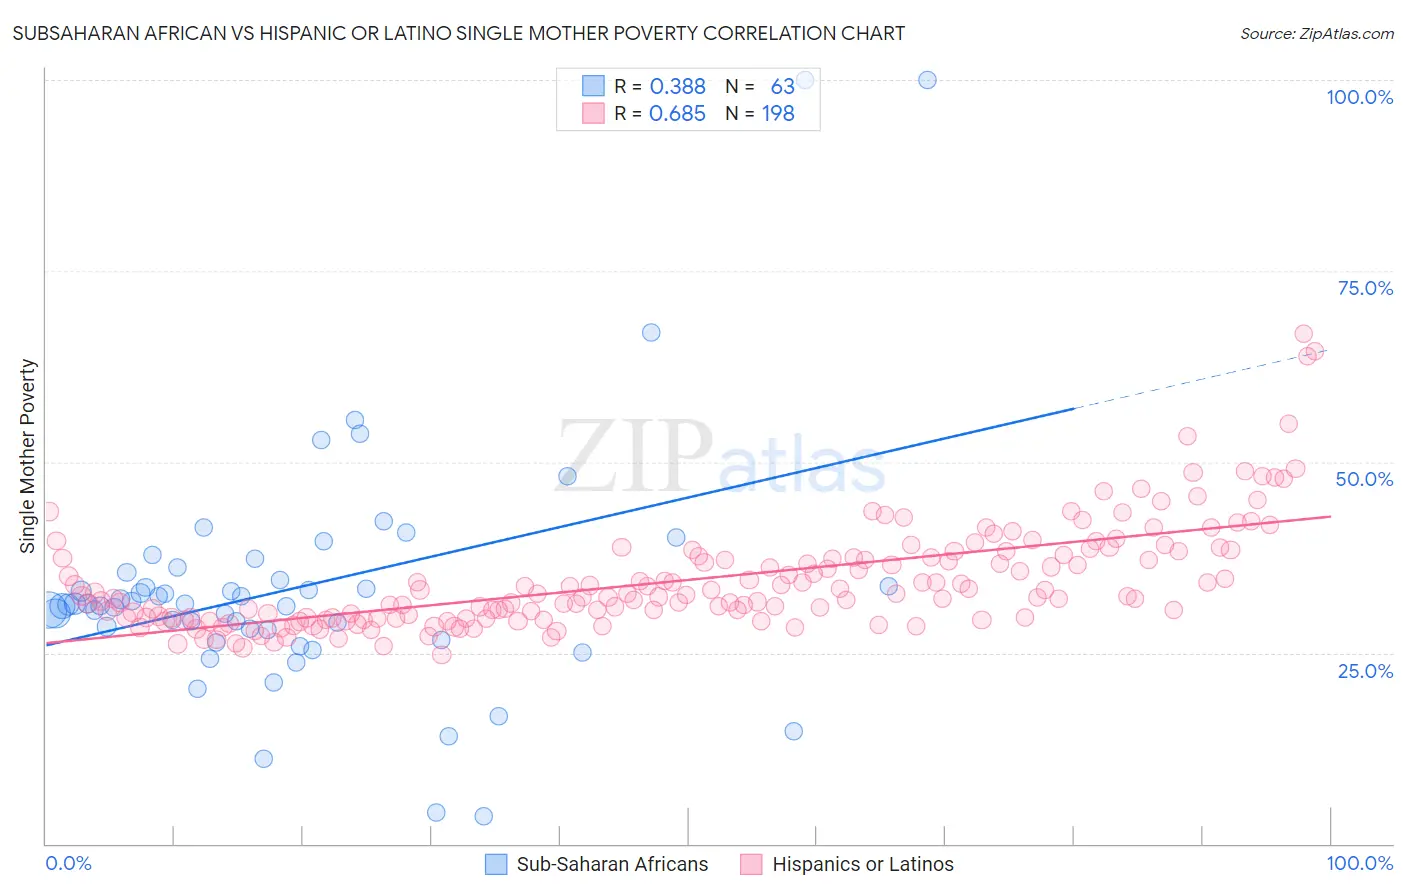
Subsaharan African vs Hispanic or Latino Single Mother Poverty Correlation Chart
The statistical analysis conducted on geographies consisting of 493,508,844 people shows a mild positive correlation between the proportion of Sub-Saharan Africans and poverty level among single mothers in the United States with a correlation coefficient (R) of 0.388 and weighted average of 31.4%. Similarly, the statistical analysis conducted on geographies consisting of 546,739,929 people shows a significant positive correlation between the proportion of Hispanics or Latinos and poverty level among single mothers in the United States with a correlation coefficient (R) of 0.685 and weighted average of 33.3%, a difference of 6.2%.
Single Mother Poverty Correlation Summary
| Measurement | Subsaharan African | Hispanic or Latino |
| Minimum | 3.7% | 24.8% |
| Maximum | 100.0% | 66.8% |
| Range | 96.3% | 42.0% |
| Mean | 33.5% | 34.5% |
| Median | 31.4% | 32.3% |
| Interquartile 25% (IQ1) | 28.1% | 29.6% |
| Interquartile 75% (IQ3) | 35.5% | 37.5% |
| Interquartile Range (IQR) | 7.4% | 8.0% |
| Standard Deviation (Sample) | 16.1% | 6.9% |
| Standard Deviation (Population) | 16.0% | 6.9% |
Similar Demographics by Single Mother Poverty
Demographics Similar to Sub-Saharan Africans by Single Mother Poverty
In terms of single mother poverty, the demographic groups most similar to Sub-Saharan Africans are German Russian (31.3%, a difference of 0.070%), Immigrants from Ecuador (31.3%, a difference of 0.090%), Bahamian (31.3%, a difference of 0.11%), Immigrants from Belize (31.4%, a difference of 0.15%), and Immigrants from Senegal (31.5%, a difference of 0.33%).
| Demographics | Rating | Rank | Single Mother Poverty |
| Immigrants | Bangladesh | 0.4 /100 | #259 | Tragic 31.1% |
| Whites/Caucasians | 0.3 /100 | #260 | Tragic 31.2% |
| Immigrants | El Salvador | 0.3 /100 | #261 | Tragic 31.2% |
| Hmong | 0.3 /100 | #262 | Tragic 31.2% |
| Bahamians | 0.2 /100 | #263 | Tragic 31.3% |
| Immigrants | Ecuador | 0.2 /100 | #264 | Tragic 31.3% |
| German Russians | 0.2 /100 | #265 | Tragic 31.3% |
| Sub-Saharan Africans | 0.2 /100 | #266 | Tragic 31.4% |
| Immigrants | Belize | 0.2 /100 | #267 | Tragic 31.4% |
| Immigrants | Senegal | 0.1 /100 | #268 | Tragic 31.5% |
| Scotch-Irish | 0.1 /100 | #269 | Tragic 31.5% |
| British West Indians | 0.1 /100 | #270 | Tragic 31.5% |
| Immigrants | Cabo Verde | 0.1 /100 | #271 | Tragic 31.6% |
| Immigrants | Micronesia | 0.1 /100 | #272 | Tragic 31.6% |
| Fijians | 0.1 /100 | #273 | Tragic 31.6% |
Demographics Similar to Hispanics or Latinos by Single Mother Poverty
In terms of single mother poverty, the demographic groups most similar to Hispanics or Latinos are Immigrants from Guatemala (33.3%, a difference of 0.0%), African (33.3%, a difference of 0.090%), Pennsylvania German (33.2%, a difference of 0.20%), Immigrants from Somalia (33.4%, a difference of 0.24%), and Blackfeet (33.2%, a difference of 0.34%).
| Demographics | Rating | Rank | Single Mother Poverty |
| Aleuts | 0.0 /100 | #293 | Tragic 32.9% |
| French American Indians | 0.0 /100 | #294 | Tragic 33.1% |
| Yaqui | 0.0 /100 | #295 | Tragic 33.1% |
| Blackfeet | 0.0 /100 | #296 | Tragic 33.2% |
| Pennsylvania Germans | 0.0 /100 | #297 | Tragic 33.2% |
| Africans | 0.0 /100 | #298 | Tragic 33.3% |
| Immigrants | Guatemala | 0.0 /100 | #299 | Tragic 33.3% |
| Hispanics or Latinos | 0.0 /100 | #300 | Tragic 33.3% |
| Immigrants | Somalia | 0.0 /100 | #301 | Tragic 33.4% |
| Arapaho | 0.0 /100 | #302 | Tragic 33.4% |
| Americans | 0.0 /100 | #303 | Tragic 33.5% |
| Mexicans | 0.0 /100 | #304 | Tragic 33.6% |
| Immigrants | Central America | 0.0 /100 | #305 | Tragic 33.6% |
| Immigrants | Congo | 0.0 /100 | #306 | Tragic 33.8% |
| Comanche | 0.0 /100 | #307 | Tragic 33.9% |