Immigrants from Bulgaria vs Hispanic or Latino Single Mother Poverty
COMPARE
Immigrants from Bulgaria
Hispanic or Latino
Single Mother Poverty
Single Mother Poverty Comparison
Immigrants from Bulgaria
Hispanics or Latinos
27.1%
SINGLE MOTHER POVERTY
99.7/ 100
METRIC RATING
54th/ 347
METRIC RANK
33.3%
SINGLE MOTHER POVERTY
0.0/ 100
METRIC RATING
300th/ 347
METRIC RANK
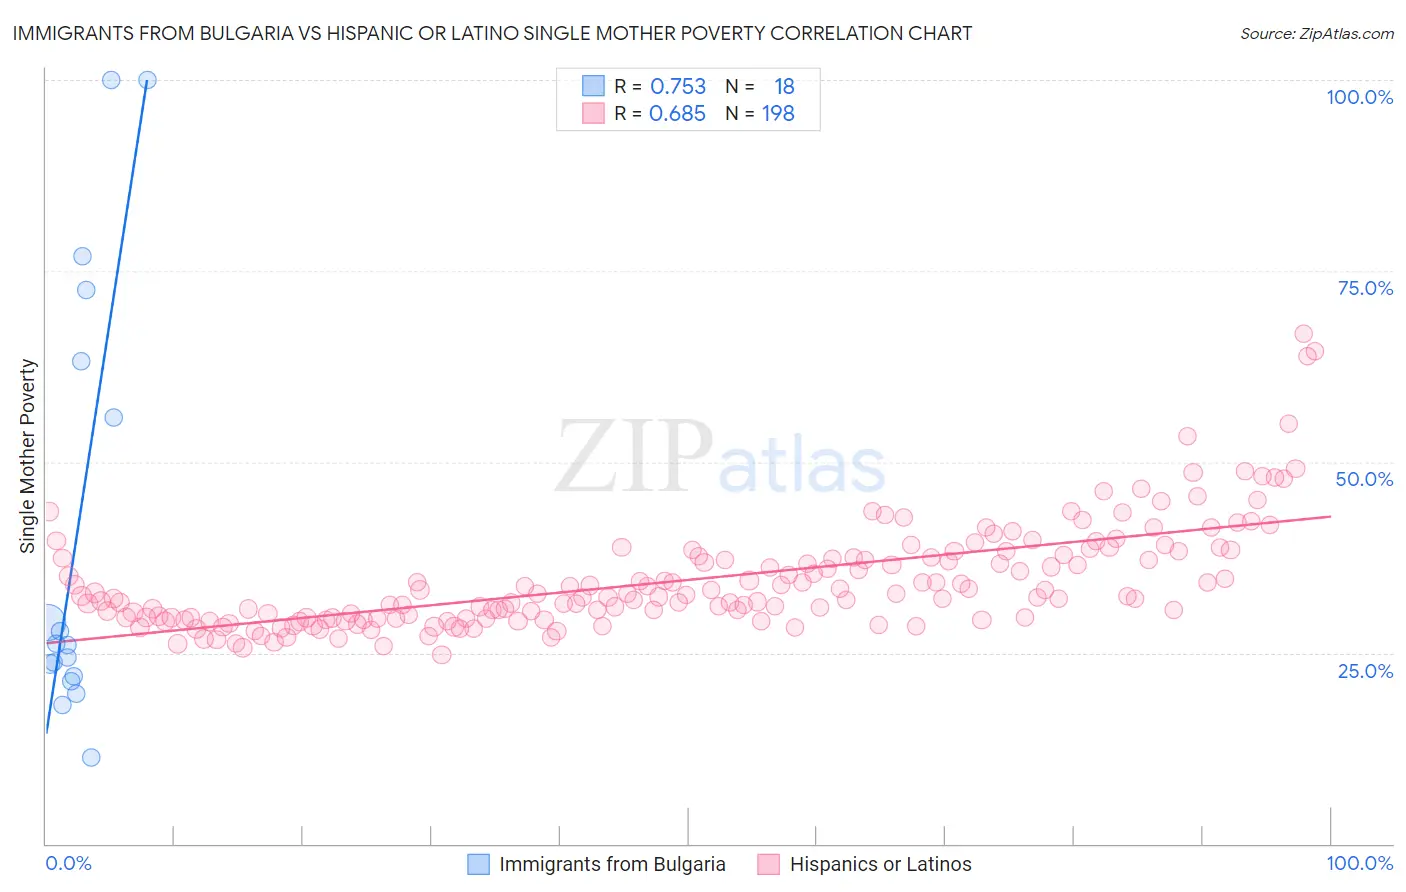
Immigrants from Bulgaria vs Hispanic or Latino Single Mother Poverty Correlation Chart
The statistical analysis conducted on geographies consisting of 170,164,064 people shows a strong positive correlation between the proportion of Immigrants from Bulgaria and poverty level among single mothers in the United States with a correlation coefficient (R) of 0.753 and weighted average of 27.1%. Similarly, the statistical analysis conducted on geographies consisting of 546,739,929 people shows a significant positive correlation between the proportion of Hispanics or Latinos and poverty level among single mothers in the United States with a correlation coefficient (R) of 0.685 and weighted average of 33.3%, a difference of 22.7%.
Single Mother Poverty Correlation Summary
| Measurement | Immigrants from Bulgaria | Hispanic or Latino |
| Minimum | 11.3% | 24.8% |
| Maximum | 100.0% | 66.8% |
| Range | 88.7% | 42.0% |
| Mean | 41.2% | 34.5% |
| Median | 26.1% | 32.3% |
| Interquartile 25% (IQ1) | 22.0% | 29.6% |
| Interquartile 75% (IQ3) | 63.2% | 37.5% |
| Interquartile Range (IQR) | 41.2% | 8.0% |
| Standard Deviation (Sample) | 28.9% | 6.9% |
| Standard Deviation (Population) | 28.1% | 6.9% |
Similar Demographics by Single Mother Poverty
Demographics Similar to Immigrants from Bulgaria by Single Mother Poverty
In terms of single mother poverty, the demographic groups most similar to Immigrants from Bulgaria are Immigrants from Jordan (27.1%, a difference of 0.030%), Immigrants from Egypt (27.1%, a difference of 0.030%), Immigrants from South Eastern Asia (27.1%, a difference of 0.070%), Immigrants from Romania (27.2%, a difference of 0.080%), and Immigrants from Argentina (27.1%, a difference of 0.11%).
| Demographics | Rating | Rank | Single Mother Poverty |
| Egyptians | 99.8 /100 | #47 | Exceptional 26.9% |
| Immigrants | Poland | 99.8 /100 | #48 | Exceptional 26.9% |
| Cambodians | 99.8 /100 | #49 | Exceptional 27.0% |
| Laotians | 99.8 /100 | #50 | Exceptional 27.0% |
| Immigrants | Argentina | 99.7 /100 | #51 | Exceptional 27.1% |
| Immigrants | South Eastern Asia | 99.7 /100 | #52 | Exceptional 27.1% |
| Immigrants | Jordan | 99.7 /100 | #53 | Exceptional 27.1% |
| Immigrants | Bulgaria | 99.7 /100 | #54 | Exceptional 27.1% |
| Immigrants | Egypt | 99.7 /100 | #55 | Exceptional 27.1% |
| Immigrants | Romania | 99.7 /100 | #56 | Exceptional 27.2% |
| Palestinians | 99.7 /100 | #57 | Exceptional 27.2% |
| Argentineans | 99.6 /100 | #58 | Exceptional 27.2% |
| Paraguayans | 99.6 /100 | #59 | Exceptional 27.2% |
| Eastern Europeans | 99.6 /100 | #60 | Exceptional 27.2% |
| Immigrants | Eastern Europe | 99.6 /100 | #61 | Exceptional 27.2% |
Demographics Similar to Hispanics or Latinos by Single Mother Poverty
In terms of single mother poverty, the demographic groups most similar to Hispanics or Latinos are Immigrants from Guatemala (33.3%, a difference of 0.0%), African (33.3%, a difference of 0.090%), Pennsylvania German (33.2%, a difference of 0.20%), Immigrants from Somalia (33.4%, a difference of 0.24%), and Blackfeet (33.2%, a difference of 0.34%).
| Demographics | Rating | Rank | Single Mother Poverty |
| Aleuts | 0.0 /100 | #293 | Tragic 32.9% |
| French American Indians | 0.0 /100 | #294 | Tragic 33.1% |
| Yaqui | 0.0 /100 | #295 | Tragic 33.1% |
| Blackfeet | 0.0 /100 | #296 | Tragic 33.2% |
| Pennsylvania Germans | 0.0 /100 | #297 | Tragic 33.2% |
| Africans | 0.0 /100 | #298 | Tragic 33.3% |
| Immigrants | Guatemala | 0.0 /100 | #299 | Tragic 33.3% |
| Hispanics or Latinos | 0.0 /100 | #300 | Tragic 33.3% |
| Immigrants | Somalia | 0.0 /100 | #301 | Tragic 33.4% |
| Arapaho | 0.0 /100 | #302 | Tragic 33.4% |
| Americans | 0.0 /100 | #303 | Tragic 33.5% |
| Mexicans | 0.0 /100 | #304 | Tragic 33.6% |
| Immigrants | Central America | 0.0 /100 | #305 | Tragic 33.6% |
| Immigrants | Congo | 0.0 /100 | #306 | Tragic 33.8% |
| Comanche | 0.0 /100 | #307 | Tragic 33.9% |