Immigrants from South America vs Hispanic or Latino Single Mother Poverty
COMPARE
Immigrants from South America
Hispanic or Latino
Single Mother Poverty
Single Mother Poverty Comparison
Immigrants from South America
Hispanics or Latinos
28.5%
SINGLE MOTHER POVERTY
86.1/ 100
METRIC RATING
145th/ 347
METRIC RANK
33.3%
SINGLE MOTHER POVERTY
0.0/ 100
METRIC RATING
300th/ 347
METRIC RANK
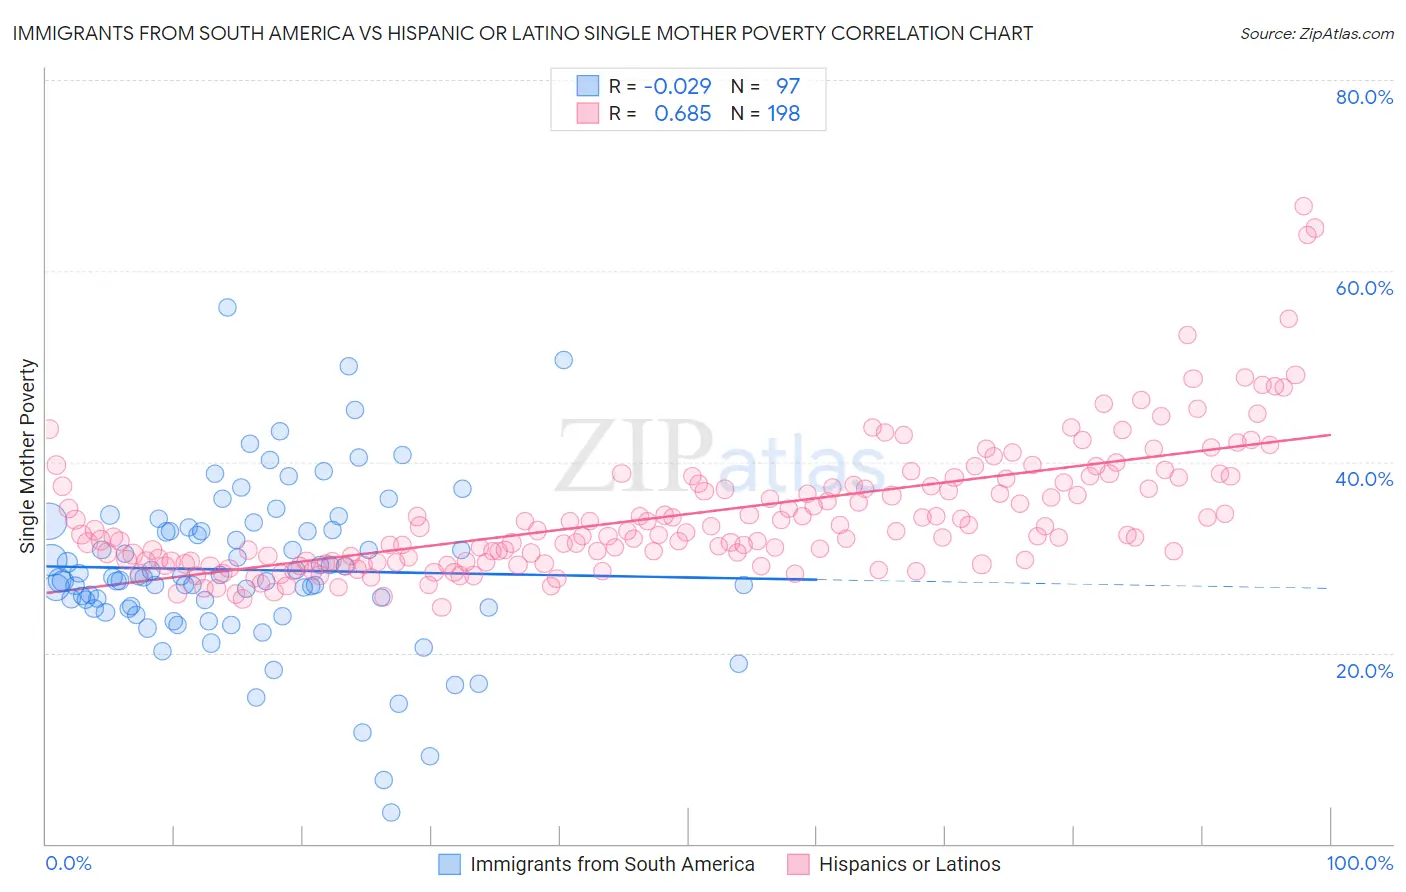
Immigrants from South America vs Hispanic or Latino Single Mother Poverty Correlation Chart
The statistical analysis conducted on geographies consisting of 470,074,100 people shows no correlation between the proportion of Immigrants from South America and poverty level among single mothers in the United States with a correlation coefficient (R) of -0.029 and weighted average of 28.5%. Similarly, the statistical analysis conducted on geographies consisting of 546,739,929 people shows a significant positive correlation between the proportion of Hispanics or Latinos and poverty level among single mothers in the United States with a correlation coefficient (R) of 0.685 and weighted average of 33.3%, a difference of 16.7%.
Single Mother Poverty Correlation Summary
| Measurement | Immigrants from South America | Hispanic or Latino |
| Minimum | 3.3% | 24.8% |
| Maximum | 56.2% | 66.8% |
| Range | 52.9% | 42.0% |
| Mean | 28.7% | 34.5% |
| Median | 27.9% | 32.3% |
| Interquartile 25% (IQ1) | 24.7% | 29.6% |
| Interquartile 75% (IQ3) | 32.8% | 37.5% |
| Interquartile Range (IQR) | 8.1% | 8.0% |
| Standard Deviation (Sample) | 8.5% | 6.9% |
| Standard Deviation (Population) | 8.5% | 6.9% |
Similar Demographics by Single Mother Poverty
Demographics Similar to Immigrants from South America by Single Mother Poverty
In terms of single mother poverty, the demographic groups most similar to Immigrants from South America are Immigrants from Denmark (28.5%, a difference of 0.0%), Luxembourger (28.5%, a difference of 0.030%), Immigrants from North America (28.5%, a difference of 0.040%), South African (28.5%, a difference of 0.050%), and Immigrants from Lebanon (28.6%, a difference of 0.080%).
| Demographics | Rating | Rank | Single Mother Poverty |
| Immigrants | Belgium | 88.5 /100 | #138 | Excellent 28.5% |
| Samoans | 88.1 /100 | #139 | Excellent 28.5% |
| Immigrants | Colombia | 88.0 /100 | #140 | Excellent 28.5% |
| Danes | 87.1 /100 | #141 | Excellent 28.5% |
| South Africans | 86.6 /100 | #142 | Excellent 28.5% |
| Immigrants | North America | 86.5 /100 | #143 | Excellent 28.5% |
| Luxembourgers | 86.4 /100 | #144 | Excellent 28.5% |
| Immigrants | South America | 86.1 /100 | #145 | Excellent 28.5% |
| Immigrants | Denmark | 86.1 /100 | #146 | Excellent 28.5% |
| Immigrants | Lebanon | 85.3 /100 | #147 | Excellent 28.6% |
| Syrians | 85.3 /100 | #148 | Excellent 28.6% |
| Serbians | 85.0 /100 | #149 | Excellent 28.6% |
| Northern Europeans | 81.7 /100 | #150 | Excellent 28.6% |
| Immigrants | Oceania | 79.9 /100 | #151 | Good 28.7% |
| Austrians | 79.0 /100 | #152 | Good 28.7% |
Demographics Similar to Hispanics or Latinos by Single Mother Poverty
In terms of single mother poverty, the demographic groups most similar to Hispanics or Latinos are Immigrants from Guatemala (33.3%, a difference of 0.0%), African (33.3%, a difference of 0.090%), Pennsylvania German (33.2%, a difference of 0.20%), Immigrants from Somalia (33.4%, a difference of 0.24%), and Blackfeet (33.2%, a difference of 0.34%).
| Demographics | Rating | Rank | Single Mother Poverty |
| Aleuts | 0.0 /100 | #293 | Tragic 32.9% |
| French American Indians | 0.0 /100 | #294 | Tragic 33.1% |
| Yaqui | 0.0 /100 | #295 | Tragic 33.1% |
| Blackfeet | 0.0 /100 | #296 | Tragic 33.2% |
| Pennsylvania Germans | 0.0 /100 | #297 | Tragic 33.2% |
| Africans | 0.0 /100 | #298 | Tragic 33.3% |
| Immigrants | Guatemala | 0.0 /100 | #299 | Tragic 33.3% |
| Hispanics or Latinos | 0.0 /100 | #300 | Tragic 33.3% |
| Immigrants | Somalia | 0.0 /100 | #301 | Tragic 33.4% |
| Arapaho | 0.0 /100 | #302 | Tragic 33.4% |
| Americans | 0.0 /100 | #303 | Tragic 33.5% |
| Mexicans | 0.0 /100 | #304 | Tragic 33.6% |
| Immigrants | Central America | 0.0 /100 | #305 | Tragic 33.6% |
| Immigrants | Congo | 0.0 /100 | #306 | Tragic 33.8% |
| Comanche | 0.0 /100 | #307 | Tragic 33.9% |