Costa Rican vs Hispanic or Latino Single Mother Poverty
COMPARE
Costa Rican
Hispanic or Latino
Single Mother Poverty
Single Mother Poverty Comparison
Costa Ricans
Hispanics or Latinos
29.0%
SINGLE MOTHER POVERTY
58.4/ 100
METRIC RATING
167th/ 347
METRIC RANK
33.3%
SINGLE MOTHER POVERTY
0.0/ 100
METRIC RATING
300th/ 347
METRIC RANK
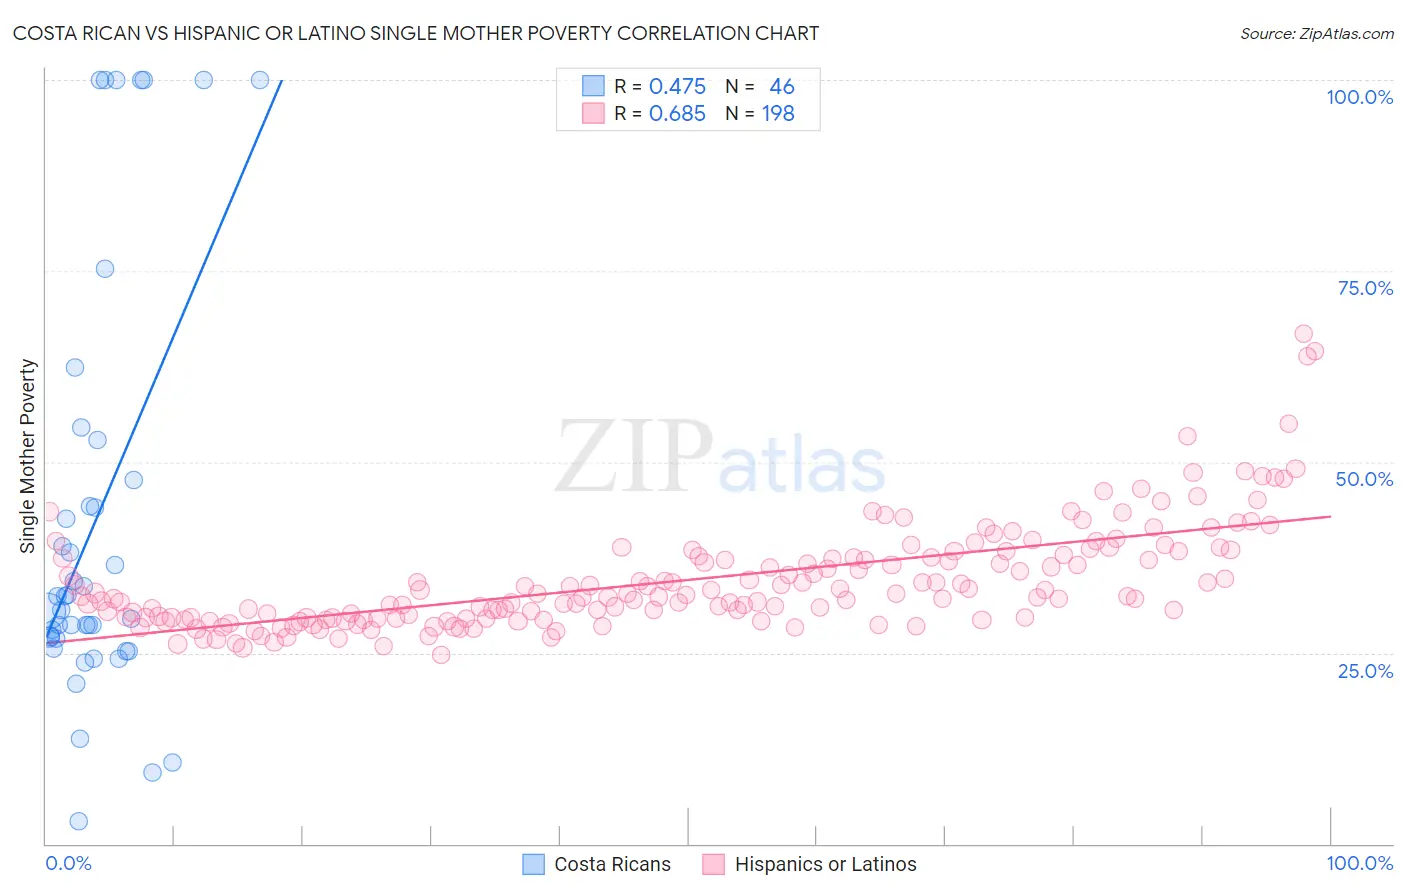
Costa Rican vs Hispanic or Latino Single Mother Poverty Correlation Chart
The statistical analysis conducted on geographies consisting of 249,968,027 people shows a moderate positive correlation between the proportion of Costa Ricans and poverty level among single mothers in the United States with a correlation coefficient (R) of 0.475 and weighted average of 29.0%. Similarly, the statistical analysis conducted on geographies consisting of 546,739,929 people shows a significant positive correlation between the proportion of Hispanics or Latinos and poverty level among single mothers in the United States with a correlation coefficient (R) of 0.685 and weighted average of 33.3%, a difference of 14.6%.
Single Mother Poverty Correlation Summary
| Measurement | Costa Rican | Hispanic or Latino |
| Minimum | 3.0% | 24.8% |
| Maximum | 100.0% | 66.8% |
| Range | 97.0% | 42.0% |
| Mean | 42.4% | 34.5% |
| Median | 31.5% | 32.3% |
| Interquartile 25% (IQ1) | 26.9% | 29.6% |
| Interquartile 75% (IQ3) | 47.6% | 37.5% |
| Interquartile Range (IQR) | 20.7% | 8.0% |
| Standard Deviation (Sample) | 27.7% | 6.9% |
| Standard Deviation (Population) | 27.4% | 6.9% |
Similar Demographics by Single Mother Poverty
Demographics Similar to Costa Ricans by Single Mother Poverty
In terms of single mother poverty, the demographic groups most similar to Costa Ricans are European (29.1%, a difference of 0.040%), Immigrants from Uruguay (29.1%, a difference of 0.060%), Inupiat (29.0%, a difference of 0.10%), Arab (29.0%, a difference of 0.12%), and New Zealander (29.1%, a difference of 0.16%).
| Demographics | Rating | Rank | Single Mother Poverty |
| Japanese | 68.0 /100 | #160 | Good 28.9% |
| Immigrants | Cambodia | 66.6 /100 | #161 | Good 28.9% |
| Scandinavians | 66.2 /100 | #162 | Good 28.9% |
| Immigrants | Nigeria | 65.9 /100 | #163 | Good 28.9% |
| Immigrants | Kenya | 65.9 /100 | #164 | Good 28.9% |
| Arabs | 60.7 /100 | #165 | Good 29.0% |
| Inupiat | 60.4 /100 | #166 | Good 29.0% |
| Costa Ricans | 58.4 /100 | #167 | Average 29.0% |
| Europeans | 57.6 /100 | #168 | Average 29.1% |
| Immigrants | Uruguay | 57.2 /100 | #169 | Average 29.1% |
| New Zealanders | 55.1 /100 | #170 | Average 29.1% |
| Puget Sound Salish | 55.1 /100 | #171 | Average 29.1% |
| Carpatho Rusyns | 53.8 /100 | #172 | Average 29.1% |
| British | 50.6 /100 | #173 | Average 29.2% |
| Immigrants | Saudi Arabia | 50.0 /100 | #174 | Average 29.2% |
Demographics Similar to Hispanics or Latinos by Single Mother Poverty
In terms of single mother poverty, the demographic groups most similar to Hispanics or Latinos are Immigrants from Guatemala (33.3%, a difference of 0.0%), African (33.3%, a difference of 0.090%), Pennsylvania German (33.2%, a difference of 0.20%), Immigrants from Somalia (33.4%, a difference of 0.24%), and Blackfeet (33.2%, a difference of 0.34%).
| Demographics | Rating | Rank | Single Mother Poverty |
| Aleuts | 0.0 /100 | #293 | Tragic 32.9% |
| French American Indians | 0.0 /100 | #294 | Tragic 33.1% |
| Yaqui | 0.0 /100 | #295 | Tragic 33.1% |
| Blackfeet | 0.0 /100 | #296 | Tragic 33.2% |
| Pennsylvania Germans | 0.0 /100 | #297 | Tragic 33.2% |
| Africans | 0.0 /100 | #298 | Tragic 33.3% |
| Immigrants | Guatemala | 0.0 /100 | #299 | Tragic 33.3% |
| Hispanics or Latinos | 0.0 /100 | #300 | Tragic 33.3% |
| Immigrants | Somalia | 0.0 /100 | #301 | Tragic 33.4% |
| Arapaho | 0.0 /100 | #302 | Tragic 33.4% |
| Americans | 0.0 /100 | #303 | Tragic 33.5% |
| Mexicans | 0.0 /100 | #304 | Tragic 33.6% |
| Immigrants | Central America | 0.0 /100 | #305 | Tragic 33.6% |
| Immigrants | Congo | 0.0 /100 | #306 | Tragic 33.8% |
| Comanche | 0.0 /100 | #307 | Tragic 33.9% |