Asian vs Immigrants from Somalia Receiving Food Stamps
COMPARE
Asian
Immigrants from Somalia
Receiving Food Stamps
Receiving Food Stamps Comparison
Asians
Immigrants from Somalia
9.7%
RECEIVING FOOD STAMPS
99.3/ 100
METRIC RATING
51st/ 347
METRIC RANK
13.7%
RECEIVING FOOD STAMPS
0.9/ 100
METRIC RATING
245th/ 347
METRIC RANK
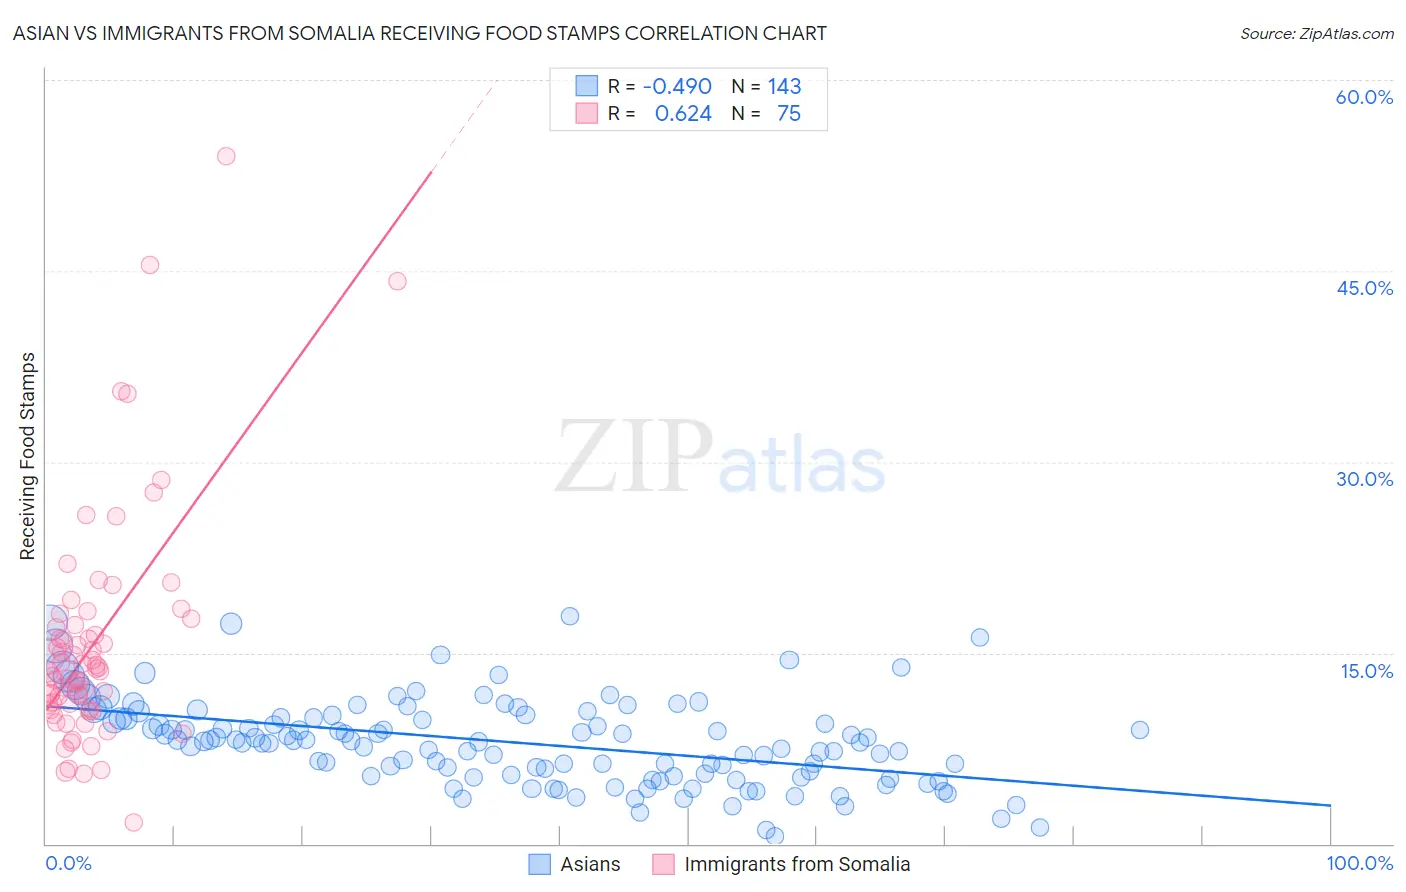
Asian vs Immigrants from Somalia Receiving Food Stamps Correlation Chart
The statistical analysis conducted on geographies consisting of 547,774,062 people shows a moderate negative correlation between the proportion of Asians and percentage of population receiving government assistance and/or food stamps in the United States with a correlation coefficient (R) of -0.490 and weighted average of 9.7%. Similarly, the statistical analysis conducted on geographies consisting of 92,085,024 people shows a significant positive correlation between the proportion of Immigrants from Somalia and percentage of population receiving government assistance and/or food stamps in the United States with a correlation coefficient (R) of 0.624 and weighted average of 13.7%, a difference of 41.3%.
Receiving Food Stamps Correlation Summary
| Measurement | Asian | Immigrants from Somalia |
| Minimum | 0.60% | 1.7% |
| Maximum | 17.9% | 54.0% |
| Range | 17.3% | 52.3% |
| Mean | 8.0% | 15.6% |
| Median | 8.0% | 13.6% |
| Interquartile 25% (IQ1) | 5.3% | 10.6% |
| Interquartile 75% (IQ3) | 9.9% | 17.2% |
| Interquartile Range (IQR) | 4.6% | 6.6% |
| Standard Deviation (Sample) | 3.4% | 9.1% |
| Standard Deviation (Population) | 3.4% | 9.0% |
Similar Demographics by Receiving Food Stamps
Demographics Similar to Asians by Receiving Food Stamps
In terms of receiving food stamps, the demographic groups most similar to Asians are Immigrants from South Africa (9.7%, a difference of 0.010%), Tongan (9.7%, a difference of 0.030%), Swiss (9.7%, a difference of 0.15%), Immigrants from Switzerland (9.7%, a difference of 0.16%), and Lithuanian (9.7%, a difference of 0.18%).
| Demographics | Rating | Rank | Receiving Food Stamps |
| Immigrants | Denmark | 99.4 /100 | #44 | Exceptional 9.6% |
| Immigrants | Belgium | 99.4 /100 | #45 | Exceptional 9.6% |
| Australians | 99.4 /100 | #46 | Exceptional 9.6% |
| Indians (Asian) | 99.4 /100 | #47 | Exceptional 9.6% |
| Russians | 99.4 /100 | #48 | Exceptional 9.6% |
| Immigrants | Czechoslovakia | 99.4 /100 | #49 | Exceptional 9.6% |
| Lithuanians | 99.4 /100 | #50 | Exceptional 9.7% |
| Asians | 99.3 /100 | #51 | Exceptional 9.7% |
| Immigrants | South Africa | 99.3 /100 | #52 | Exceptional 9.7% |
| Tongans | 99.3 /100 | #53 | Exceptional 9.7% |
| Swiss | 99.3 /100 | #54 | Exceptional 9.7% |
| Immigrants | Switzerland | 99.3 /100 | #55 | Exceptional 9.7% |
| Immigrants | Canada | 99.3 /100 | #56 | Exceptional 9.7% |
| Greeks | 99.3 /100 | #57 | Exceptional 9.7% |
| Scandinavians | 99.2 /100 | #58 | Exceptional 9.7% |
Demographics Similar to Immigrants from Somalia by Receiving Food Stamps
In terms of receiving food stamps, the demographic groups most similar to Immigrants from Somalia are Cajun (13.7%, a difference of 0.040%), Somali (13.7%, a difference of 0.20%), Cree (13.7%, a difference of 0.24%), Immigrants from Panama (13.6%, a difference of 0.39%), and Mexican American Indian (13.8%, a difference of 0.51%).
| Demographics | Rating | Rank | Receiving Food Stamps |
| French American Indians | 1.4 /100 | #238 | Tragic 13.5% |
| Immigrants | Micronesia | 1.3 /100 | #239 | Tragic 13.5% |
| Iroquois | 1.2 /100 | #240 | Tragic 13.5% |
| Choctaw | 1.0 /100 | #241 | Tragic 13.6% |
| Immigrants | Panama | 1.0 /100 | #242 | Tragic 13.6% |
| Somalis | 0.9 /100 | #243 | Tragic 13.7% |
| Cajuns | 0.9 /100 | #244 | Tragic 13.7% |
| Immigrants | Somalia | 0.9 /100 | #245 | Tragic 13.7% |
| Cree | 0.8 /100 | #246 | Tragic 13.7% |
| Mexican American Indians | 0.7 /100 | #247 | Tragic 13.8% |
| Immigrants | Laos | 0.7 /100 | #248 | Tragic 13.8% |
| Indonesians | 0.6 /100 | #249 | Tragic 13.9% |
| Immigrants | Cambodia | 0.5 /100 | #250 | Tragic 13.9% |
| Yaqui | 0.5 /100 | #251 | Tragic 13.9% |
| Ghanaians | 0.5 /100 | #252 | Tragic 14.0% |