Asian vs Subsaharan African Receiving Food Stamps
COMPARE
Asian
Subsaharan African
Receiving Food Stamps
Receiving Food Stamps Comparison
Asians
Sub-Saharan Africans
9.7%
RECEIVING FOOD STAMPS
99.3/ 100
METRIC RATING
51st/ 347
METRIC RANK
14.1%
RECEIVING FOOD STAMPS
0.3/ 100
METRIC RATING
255th/ 347
METRIC RANK
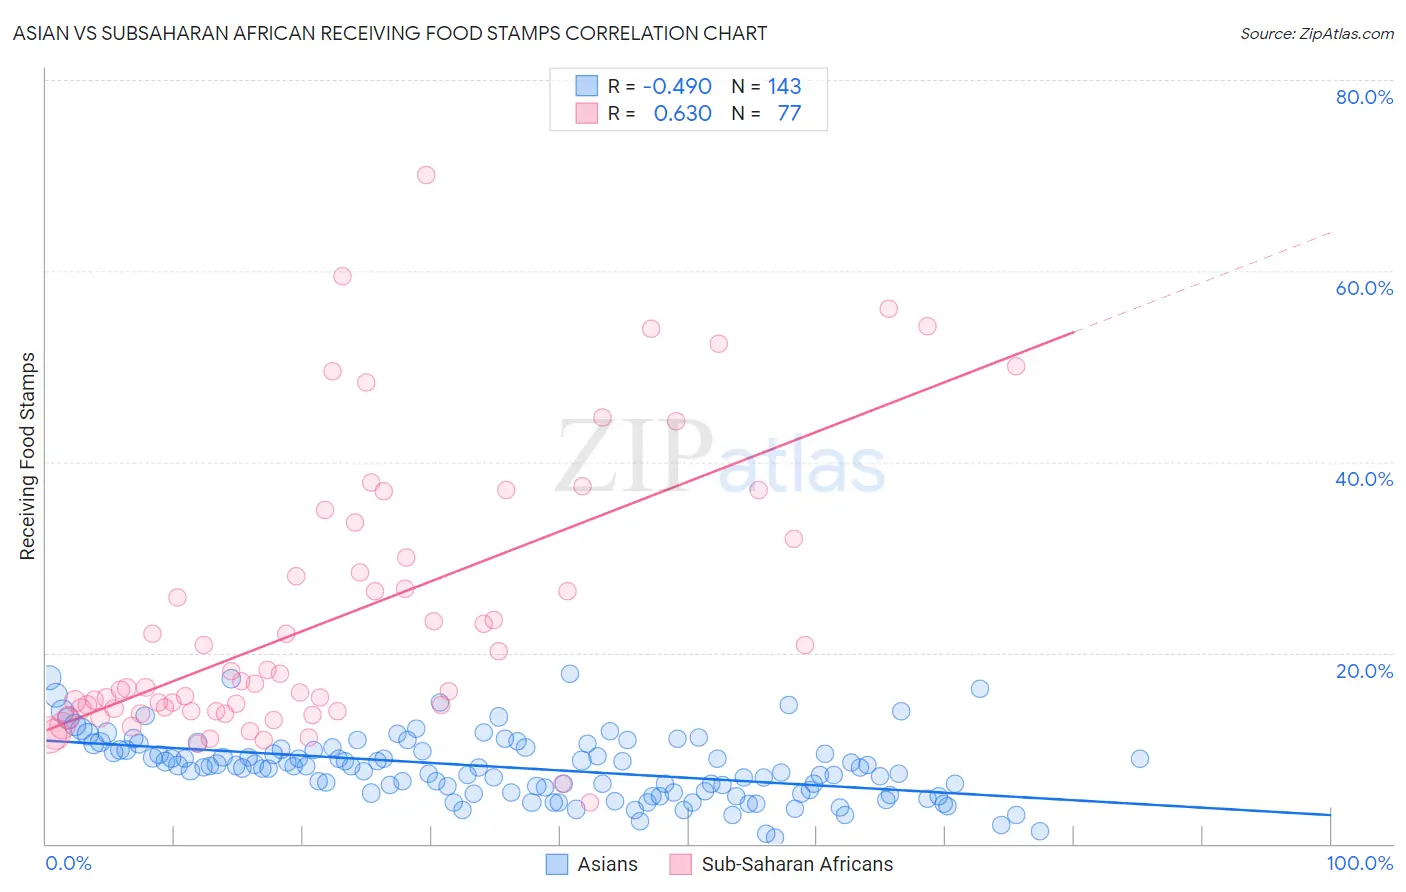
Asian vs Subsaharan African Receiving Food Stamps Correlation Chart
The statistical analysis conducted on geographies consisting of 547,774,062 people shows a moderate negative correlation between the proportion of Asians and percentage of population receiving government assistance and/or food stamps in the United States with a correlation coefficient (R) of -0.490 and weighted average of 9.7%. Similarly, the statistical analysis conducted on geographies consisting of 506,389,803 people shows a significant positive correlation between the proportion of Sub-Saharan Africans and percentage of population receiving government assistance and/or food stamps in the United States with a correlation coefficient (R) of 0.630 and weighted average of 14.1%, a difference of 45.5%.
Receiving Food Stamps Correlation Summary
| Measurement | Asian | Subsaharan African |
| Minimum | 0.60% | 4.3% |
| Maximum | 17.9% | 70.0% |
| Range | 17.3% | 65.7% |
| Mean | 8.0% | 23.8% |
| Median | 8.0% | 16.8% |
| Interquartile 25% (IQ1) | 5.3% | 13.9% |
| Interquartile 75% (IQ3) | 9.9% | 31.0% |
| Interquartile Range (IQR) | 4.6% | 17.1% |
| Standard Deviation (Sample) | 3.4% | 14.4% |
| Standard Deviation (Population) | 3.4% | 14.3% |
Similar Demographics by Receiving Food Stamps
Demographics Similar to Asians by Receiving Food Stamps
In terms of receiving food stamps, the demographic groups most similar to Asians are Immigrants from South Africa (9.7%, a difference of 0.010%), Tongan (9.7%, a difference of 0.030%), Swiss (9.7%, a difference of 0.15%), Immigrants from Switzerland (9.7%, a difference of 0.16%), and Lithuanian (9.7%, a difference of 0.18%).
| Demographics | Rating | Rank | Receiving Food Stamps |
| Immigrants | Denmark | 99.4 /100 | #44 | Exceptional 9.6% |
| Immigrants | Belgium | 99.4 /100 | #45 | Exceptional 9.6% |
| Australians | 99.4 /100 | #46 | Exceptional 9.6% |
| Indians (Asian) | 99.4 /100 | #47 | Exceptional 9.6% |
| Russians | 99.4 /100 | #48 | Exceptional 9.6% |
| Immigrants | Czechoslovakia | 99.4 /100 | #49 | Exceptional 9.6% |
| Lithuanians | 99.4 /100 | #50 | Exceptional 9.7% |
| Asians | 99.3 /100 | #51 | Exceptional 9.7% |
| Immigrants | South Africa | 99.3 /100 | #52 | Exceptional 9.7% |
| Tongans | 99.3 /100 | #53 | Exceptional 9.7% |
| Swiss | 99.3 /100 | #54 | Exceptional 9.7% |
| Immigrants | Switzerland | 99.3 /100 | #55 | Exceptional 9.7% |
| Immigrants | Canada | 99.3 /100 | #56 | Exceptional 9.7% |
| Greeks | 99.3 /100 | #57 | Exceptional 9.7% |
| Scandinavians | 99.2 /100 | #58 | Exceptional 9.7% |
Demographics Similar to Sub-Saharan Africans by Receiving Food Stamps
In terms of receiving food stamps, the demographic groups most similar to Sub-Saharan Africans are Marshallese (14.1%, a difference of 0.010%), Japanese (14.1%, a difference of 0.020%), Arapaho (14.1%, a difference of 0.12%), Immigrants from Ghana (14.1%, a difference of 0.20%), and Creek (14.1%, a difference of 0.33%).
| Demographics | Rating | Rank | Receiving Food Stamps |
| Immigrants | Laos | 0.7 /100 | #248 | Tragic 13.8% |
| Indonesians | 0.6 /100 | #249 | Tragic 13.9% |
| Immigrants | Cambodia | 0.5 /100 | #250 | Tragic 13.9% |
| Yaqui | 0.5 /100 | #251 | Tragic 13.9% |
| Ghanaians | 0.5 /100 | #252 | Tragic 14.0% |
| Spanish Americans | 0.4 /100 | #253 | Tragic 14.0% |
| Marshallese | 0.3 /100 | #254 | Tragic 14.1% |
| Sub-Saharan Africans | 0.3 /100 | #255 | Tragic 14.1% |
| Japanese | 0.3 /100 | #256 | Tragic 14.1% |
| Arapaho | 0.3 /100 | #257 | Tragic 14.1% |
| Immigrants | Ghana | 0.3 /100 | #258 | Tragic 14.1% |
| Creek | 0.3 /100 | #259 | Tragic 14.1% |
| Central Americans | 0.3 /100 | #260 | Tragic 14.1% |
| Immigrants | Congo | 0.3 /100 | #261 | Tragic 14.1% |
| Paiute | 0.2 /100 | #262 | Tragic 14.3% |