Jamaican vs Chippewa Receiving Food Stamps
COMPARE
Jamaican
Chippewa
Receiving Food Stamps
Receiving Food Stamps Comparison
Jamaicans
Chippewa
16.4%
RECEIVING FOOD STAMPS
0.0/ 100
METRIC RATING
306th/ 347
METRIC RANK
14.7%
RECEIVING FOOD STAMPS
0.1/ 100
METRIC RATING
272nd/ 347
METRIC RANK
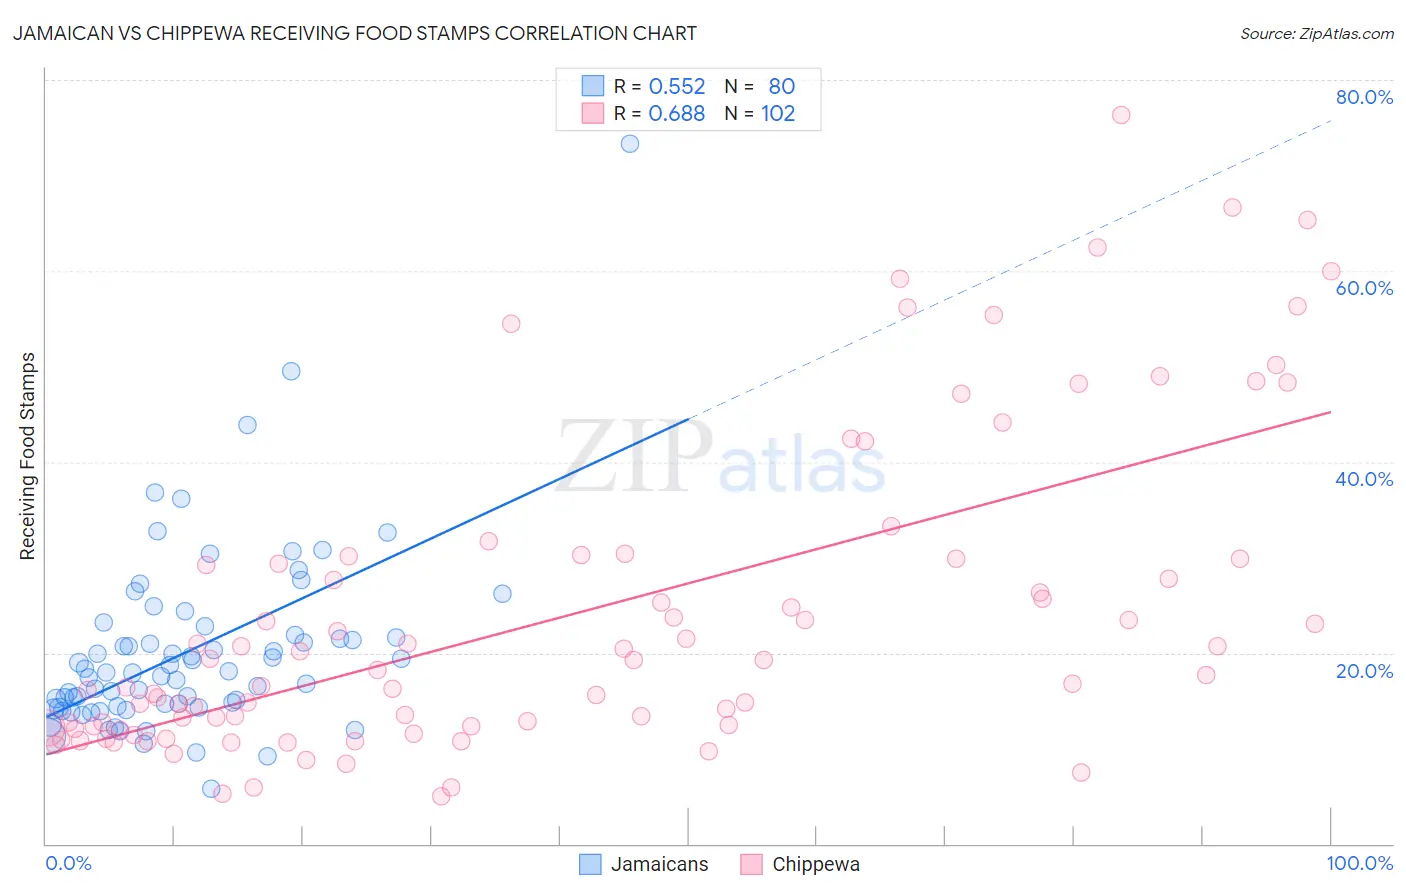
Jamaican vs Chippewa Receiving Food Stamps Correlation Chart
The statistical analysis conducted on geographies consisting of 367,071,648 people shows a substantial positive correlation between the proportion of Jamaicans and percentage of population receiving government assistance and/or food stamps in the United States with a correlation coefficient (R) of 0.552 and weighted average of 16.4%. Similarly, the statistical analysis conducted on geographies consisting of 214,846,043 people shows a significant positive correlation between the proportion of Chippewa and percentage of population receiving government assistance and/or food stamps in the United States with a correlation coefficient (R) of 0.688 and weighted average of 14.7%, a difference of 11.7%.
Receiving Food Stamps Correlation Summary
| Measurement | Jamaican | Chippewa |
| Minimum | 5.8% | 5.0% |
| Maximum | 73.3% | 76.3% |
| Range | 67.5% | 71.3% |
| Mean | 20.1% | 24.0% |
| Median | 17.9% | 17.9% |
| Interquartile 25% (IQ1) | 14.4% | 12.3% |
| Interquartile 75% (IQ3) | 21.7% | 29.8% |
| Interquartile Range (IQR) | 7.3% | 17.5% |
| Standard Deviation (Sample) | 9.8% | 16.4% |
| Standard Deviation (Population) | 9.7% | 16.3% |
Similar Demographics by Receiving Food Stamps
Demographics Similar to Jamaicans by Receiving Food Stamps
In terms of receiving food stamps, the demographic groups most similar to Jamaicans are Immigrants from the Azores (16.4%, a difference of 0.070%), Houma (16.5%, a difference of 0.29%), Barbadian (16.5%, a difference of 0.55%), U.S. Virgin Islander (16.5%, a difference of 0.79%), and West Indian (16.3%, a difference of 0.94%).
| Demographics | Rating | Rank | Receiving Food Stamps |
| Hispanics or Latinos | 0.0 /100 | #299 | Tragic 15.8% |
| Immigrants | Bangladesh | 0.0 /100 | #300 | Tragic 15.9% |
| Trinidadians and Tobagonians | 0.0 /100 | #301 | Tragic 16.0% |
| Immigrants | West Indies | 0.0 /100 | #302 | Tragic 16.1% |
| Nicaraguans | 0.0 /100 | #303 | Tragic 16.1% |
| West Indians | 0.0 /100 | #304 | Tragic 16.3% |
| Immigrants | Azores | 0.0 /100 | #305 | Tragic 16.4% |
| Jamaicans | 0.0 /100 | #306 | Tragic 16.4% |
| Houma | 0.0 /100 | #307 | Tragic 16.5% |
| Barbadians | 0.0 /100 | #308 | Tragic 16.5% |
| U.S. Virgin Islanders | 0.0 /100 | #309 | Tragic 16.5% |
| Immigrants | Barbados | 0.0 /100 | #310 | Tragic 16.6% |
| Guyanese | 0.0 /100 | #311 | Tragic 16.7% |
| Sioux | 0.0 /100 | #312 | Tragic 16.8% |
| Immigrants | Jamaica | 0.0 /100 | #313 | Tragic 16.9% |
Demographics Similar to Chippewa by Receiving Food Stamps
In terms of receiving food stamps, the demographic groups most similar to Chippewa are Alaskan Athabascan (14.7%, a difference of 0.030%), Immigrants from Western Africa (14.7%, a difference of 0.050%), Ute (14.7%, a difference of 0.13%), Immigrants from Guatemala (14.6%, a difference of 0.22%), and Mexican (14.6%, a difference of 0.32%).
| Demographics | Rating | Rank | Receiving Food Stamps |
| Blackfeet | 0.2 /100 | #265 | Tragic 14.3% |
| Cheyenne | 0.2 /100 | #266 | Tragic 14.3% |
| Dutch West Indians | 0.2 /100 | #267 | Tragic 14.3% |
| Guatemalans | 0.1 /100 | #268 | Tragic 14.4% |
| Nepalese | 0.1 /100 | #269 | Tragic 14.6% |
| Mexicans | 0.1 /100 | #270 | Tragic 14.6% |
| Immigrants | Guatemala | 0.1 /100 | #271 | Tragic 14.6% |
| Chippewa | 0.1 /100 | #272 | Tragic 14.7% |
| Alaskan Athabascans | 0.1 /100 | #273 | Tragic 14.7% |
| Immigrants | Western Africa | 0.1 /100 | #274 | Tragic 14.7% |
| Ute | 0.1 /100 | #275 | Tragic 14.7% |
| Liberians | 0.1 /100 | #276 | Tragic 14.8% |
| Seminole | 0.1 /100 | #277 | Tragic 14.8% |
| Belizeans | 0.1 /100 | #278 | Tragic 14.8% |
| Kiowa | 0.0 /100 | #279 | Tragic 14.9% |