Armenian vs Uruguayan Female Poverty Among 25-34 Year Olds
COMPARE
Armenian
Uruguayan
Female Poverty Among 25-34 Year Olds
Female Poverty Among 25-34 Year Olds Comparison
Armenians
Uruguayans
12.2%
FEMALE POVERTY AMONG 25-34 YEAR OLDS
99.2/ 100
METRIC RATING
65th/ 347
METRIC RANK
13.3%
FEMALE POVERTY AMONG 25-34 YEAR OLDS
66.9/ 100
METRIC RATING
159th/ 347
METRIC RANK
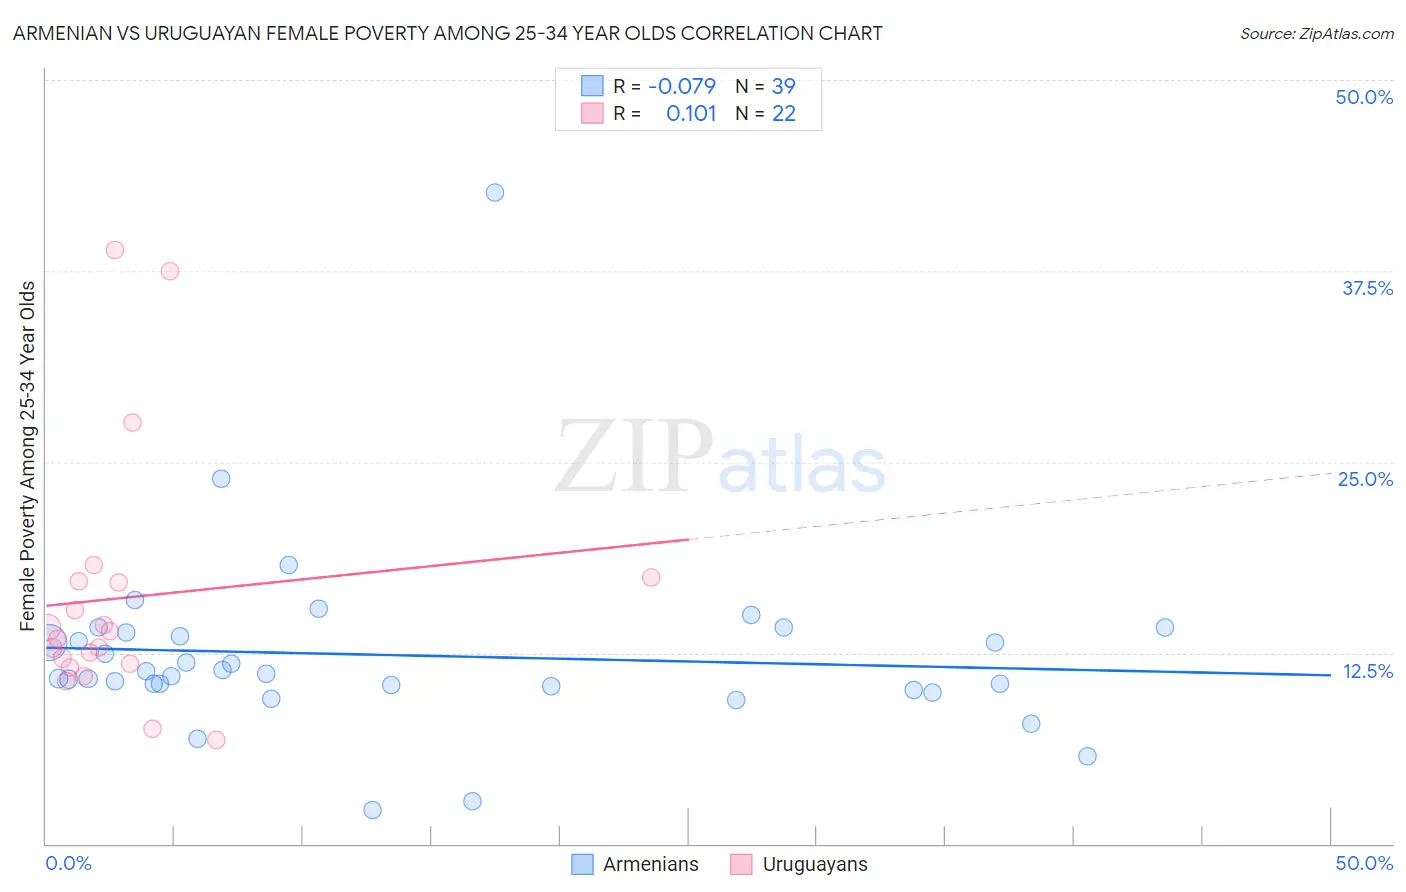
Armenian vs Uruguayan Female Poverty Among 25-34 Year Olds Correlation Chart
The statistical analysis conducted on geographies consisting of 305,860,735 people shows a slight negative correlation between the proportion of Armenians and poverty level among females between the ages 25 and 34 in the United States with a correlation coefficient (R) of -0.079 and weighted average of 12.2%. Similarly, the statistical analysis conducted on geographies consisting of 143,910,872 people shows a poor positive correlation between the proportion of Uruguayans and poverty level among females between the ages 25 and 34 in the United States with a correlation coefficient (R) of 0.101 and weighted average of 13.3%, a difference of 9.6%.
Female Poverty Among 25-34 Year Olds Correlation Summary
| Measurement | Armenian | Uruguayan |
| Minimum | 2.2% | 6.8% |
| Maximum | 42.7% | 38.9% |
| Range | 40.4% | 32.1% |
| Mean | 12.3% | 16.1% |
| Median | 11.1% | 13.7% |
| Interquartile 25% (IQ1) | 10.3% | 11.8% |
| Interquartile 75% (IQ3) | 13.8% | 17.2% |
| Interquartile Range (IQR) | 3.6% | 5.4% |
| Standard Deviation (Sample) | 6.2% | 8.3% |
| Standard Deviation (Population) | 6.2% | 8.1% |
Similar Demographics by Female Poverty Among 25-34 Year Olds
Demographics Similar to Armenians by Female Poverty Among 25-34 Year Olds
In terms of female poverty among 25-34 year olds, the demographic groups most similar to Armenians are Immigrants from Russia (12.2%, a difference of 0.020%), Immigrants from Europe (12.2%, a difference of 0.060%), Laotian (12.2%, a difference of 0.17%), Soviet Union (12.1%, a difference of 0.25%), and Immigrants from Moldova (12.1%, a difference of 0.27%).
| Demographics | Rating | Rank | Female Poverty Among 25-34 Year Olds |
| Immigrants | Romania | 99.4 /100 | #58 | Exceptional 12.1% |
| Russians | 99.4 /100 | #59 | Exceptional 12.1% |
| Immigrants | Northern Europe | 99.4 /100 | #60 | Exceptional 12.1% |
| Immigrants | Czechoslovakia | 99.4 /100 | #61 | Exceptional 12.1% |
| Immigrants | Moldova | 99.3 /100 | #62 | Exceptional 12.1% |
| Soviet Union | 99.3 /100 | #63 | Exceptional 12.1% |
| Immigrants | Russia | 99.2 /100 | #64 | Exceptional 12.2% |
| Armenians | 99.2 /100 | #65 | Exceptional 12.2% |
| Immigrants | Europe | 99.2 /100 | #66 | Exceptional 12.2% |
| Laotians | 99.2 /100 | #67 | Exceptional 12.2% |
| Sri Lankans | 99.1 /100 | #68 | Exceptional 12.2% |
| Immigrants | Lebanon | 99.1 /100 | #69 | Exceptional 12.2% |
| Immigrants | Belgium | 99.1 /100 | #70 | Exceptional 12.2% |
| Immigrants | Scotland | 99.1 /100 | #71 | Exceptional 12.2% |
| Lithuanians | 99.1 /100 | #72 | Exceptional 12.2% |
Demographics Similar to Uruguayans by Female Poverty Among 25-34 Year Olds
In terms of female poverty among 25-34 year olds, the demographic groups most similar to Uruguayans are Immigrants from South America (13.3%, a difference of 0.050%), Icelander (13.3%, a difference of 0.12%), Immigrants from Colombia (13.3%, a difference of 0.22%), Ugandan (13.4%, a difference of 0.26%), and British (13.4%, a difference of 0.32%).
| Demographics | Rating | Rank | Female Poverty Among 25-34 Year Olds |
| Slavs | 75.7 /100 | #152 | Good 13.2% |
| Northern Europeans | 73.7 /100 | #153 | Good 13.2% |
| Arabs | 73.5 /100 | #154 | Good 13.2% |
| Immigrants | Sierra Leone | 72.9 /100 | #155 | Good 13.3% |
| Immigrants | Cameroon | 72.0 /100 | #156 | Good 13.3% |
| Immigrants | Western Europe | 70.3 /100 | #157 | Good 13.3% |
| Immigrants | Colombia | 69.2 /100 | #158 | Good 13.3% |
| Uruguayans | 66.9 /100 | #159 | Good 13.3% |
| Immigrants | South America | 66.3 /100 | #160 | Good 13.3% |
| Icelanders | 65.7 /100 | #161 | Good 13.3% |
| Ugandans | 64.1 /100 | #162 | Good 13.4% |
| British | 63.5 /100 | #163 | Good 13.4% |
| Swiss | 61.7 /100 | #164 | Good 13.4% |
| Basques | 59.3 /100 | #165 | Average 13.4% |
| Belgians | 58.9 /100 | #166 | Average 13.4% |