Armenian vs Immigrants from Belarus Female Poverty Among 25-34 Year Olds
COMPARE
Armenian
Immigrants from Belarus
Female Poverty Among 25-34 Year Olds
Female Poverty Among 25-34 Year Olds Comparison
Armenians
Immigrants from Belarus
12.2%
FEMALE POVERTY AMONG 25-34 YEAR OLDS
99.2/ 100
METRIC RATING
65th/ 347
METRIC RANK
12.0%
FEMALE POVERTY AMONG 25-34 YEAR OLDS
99.6/ 100
METRIC RATING
48th/ 347
METRIC RANK
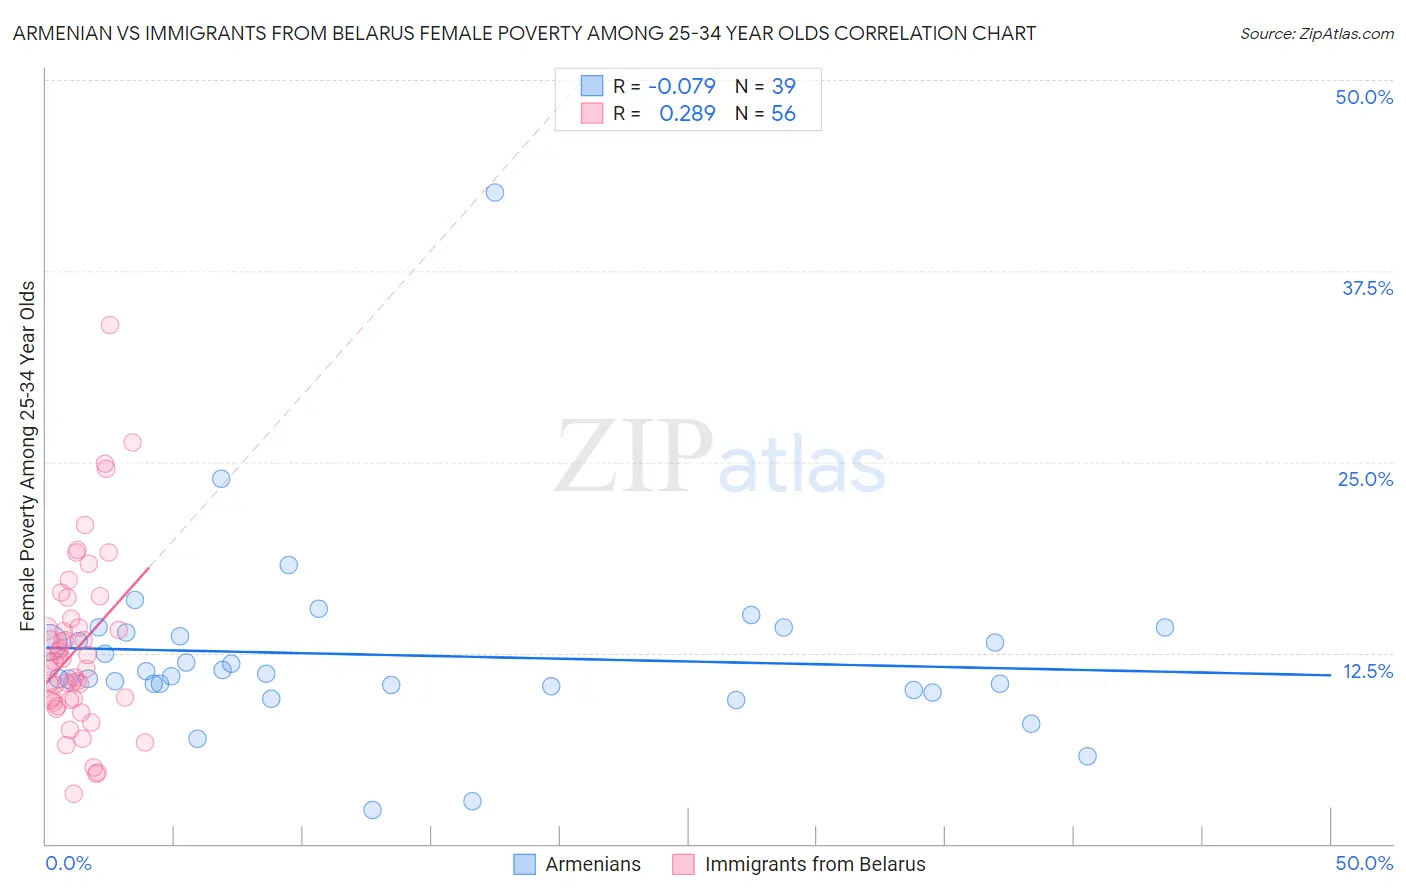
Armenian vs Immigrants from Belarus Female Poverty Among 25-34 Year Olds Correlation Chart
The statistical analysis conducted on geographies consisting of 305,860,735 people shows a slight negative correlation between the proportion of Armenians and poverty level among females between the ages 25 and 34 in the United States with a correlation coefficient (R) of -0.079 and weighted average of 12.2%. Similarly, the statistical analysis conducted on geographies consisting of 148,573,178 people shows a weak positive correlation between the proportion of Immigrants from Belarus and poverty level among females between the ages 25 and 34 in the United States with a correlation coefficient (R) of 0.289 and weighted average of 12.0%, a difference of 1.7%.
Female Poverty Among 25-34 Year Olds Correlation Summary
| Measurement | Armenian | Immigrants from Belarus |
| Minimum | 2.2% | 3.3% |
| Maximum | 42.7% | 34.0% |
| Range | 40.4% | 30.7% |
| Mean | 12.3% | 12.8% |
| Median | 11.1% | 11.9% |
| Interquartile 25% (IQ1) | 10.3% | 9.4% |
| Interquartile 75% (IQ3) | 13.8% | 14.4% |
| Interquartile Range (IQR) | 3.6% | 5.0% |
| Standard Deviation (Sample) | 6.2% | 5.7% |
| Standard Deviation (Population) | 6.2% | 5.7% |
Demographics Similar to Armenians and Immigrants from Belarus by Female Poverty Among 25-34 Year Olds
In terms of female poverty among 25-34 year olds, the demographic groups most similar to Armenians are Immigrants from Russia (12.2%, a difference of 0.020%), Immigrants from Europe (12.2%, a difference of 0.060%), Soviet Union (12.1%, a difference of 0.25%), Immigrants from Moldova (12.1%, a difference of 0.27%), and Immigrants from Czechoslovakia (12.1%, a difference of 0.44%). Similarly, the demographic groups most similar to Immigrants from Belarus are Korean (12.0%, a difference of 0.050%), Immigrants from Egypt (12.0%, a difference of 0.080%), Immigrants from Croatia (12.0%, a difference of 0.090%), Paraguayan (12.0%, a difference of 0.10%), and Immigrants from Eastern Europe (12.0%, a difference of 0.12%).
| Demographics | Rating | Rank | Female Poverty Among 25-34 Year Olds |
| Immigrants | Serbia | 99.7 /100 | #46 | Exceptional 11.9% |
| Koreans | 99.6 /100 | #47 | Exceptional 12.0% |
| Immigrants | Belarus | 99.6 /100 | #48 | Exceptional 12.0% |
| Immigrants | Egypt | 99.6 /100 | #49 | Exceptional 12.0% |
| Immigrants | Croatia | 99.6 /100 | #50 | Exceptional 12.0% |
| Paraguayans | 99.6 /100 | #51 | Exceptional 12.0% |
| Immigrants | Eastern Europe | 99.6 /100 | #52 | Exceptional 12.0% |
| Immigrants | Israel | 99.6 /100 | #53 | Exceptional 12.0% |
| Eastern Europeans | 99.6 /100 | #54 | Exceptional 12.0% |
| Immigrants | Philippines | 99.5 /100 | #55 | Exceptional 12.0% |
| Luxembourgers | 99.5 /100 | #56 | Exceptional 12.1% |
| Jordanians | 99.4 /100 | #57 | Exceptional 12.1% |
| Immigrants | Romania | 99.4 /100 | #58 | Exceptional 12.1% |
| Russians | 99.4 /100 | #59 | Exceptional 12.1% |
| Immigrants | Northern Europe | 99.4 /100 | #60 | Exceptional 12.1% |
| Immigrants | Czechoslovakia | 99.4 /100 | #61 | Exceptional 12.1% |
| Immigrants | Moldova | 99.3 /100 | #62 | Exceptional 12.1% |
| Soviet Union | 99.3 /100 | #63 | Exceptional 12.1% |
| Immigrants | Russia | 99.2 /100 | #64 | Exceptional 12.2% |
| Armenians | 99.2 /100 | #65 | Exceptional 12.2% |
| Immigrants | Europe | 99.2 /100 | #66 | Exceptional 12.2% |