Argentinean vs Immigrants from West Indies Single Mother Households
COMPARE
Argentinean
Immigrants from West Indies
Single Mother Households
Single Mother Households Comparison
Argentineans
Immigrants from West Indies
5.8%
SINGLE MOTHER HOUSEHOLDS
93.7/ 100
METRIC RATING
121st/ 347
METRIC RANK
7.9%
SINGLE MOTHER HOUSEHOLDS
0.0/ 100
METRIC RATING
298th/ 347
METRIC RANK
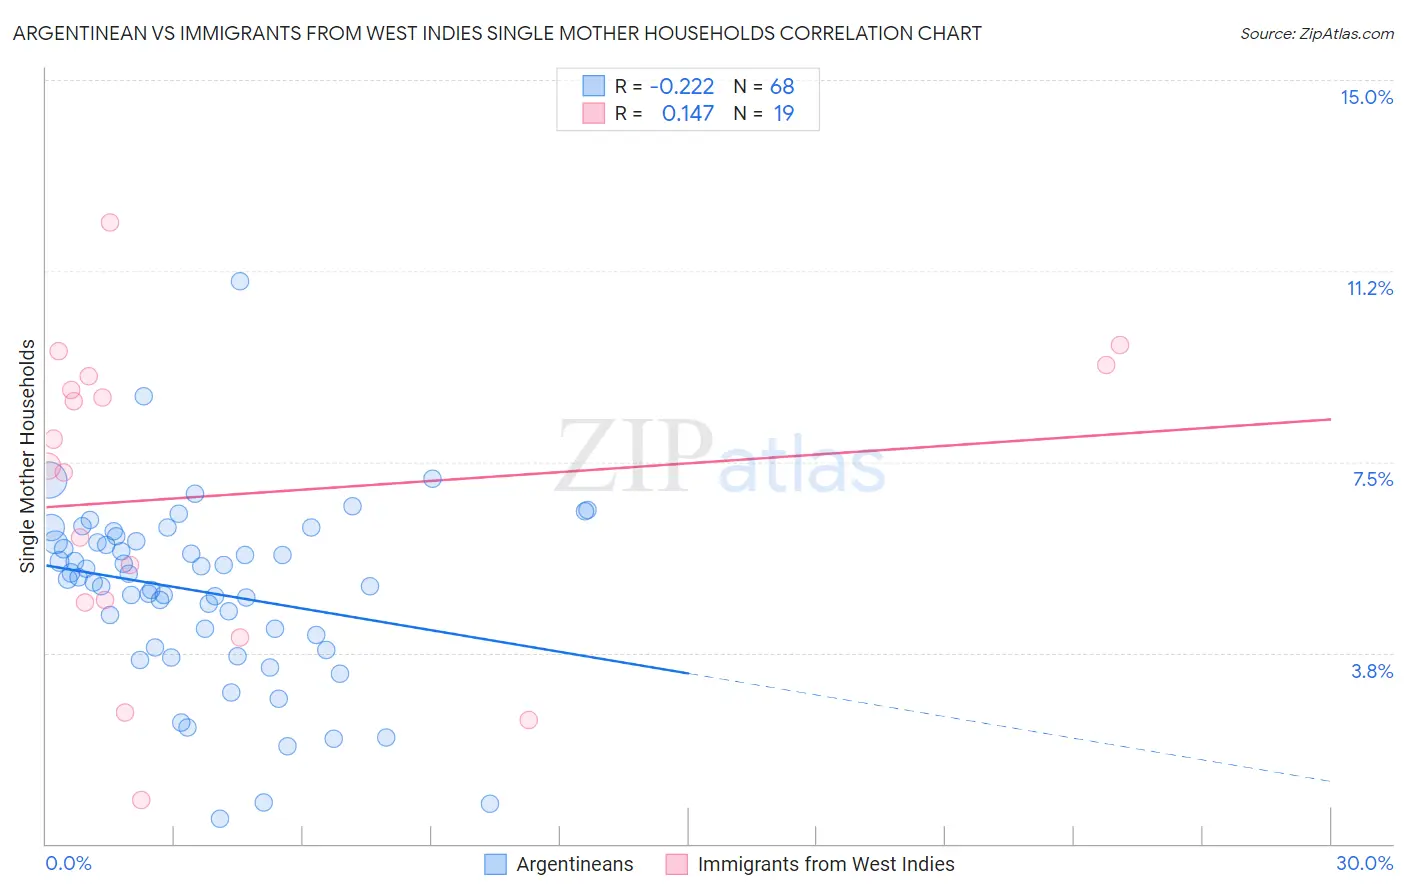
Argentinean vs Immigrants from West Indies Single Mother Households Correlation Chart
The statistical analysis conducted on geographies consisting of 296,614,684 people shows a weak negative correlation between the proportion of Argentineans and percentage of single mother households in the United States with a correlation coefficient (R) of -0.222 and weighted average of 5.8%. Similarly, the statistical analysis conducted on geographies consisting of 72,447,708 people shows a poor positive correlation between the proportion of Immigrants from West Indies and percentage of single mother households in the United States with a correlation coefficient (R) of 0.147 and weighted average of 7.9%, a difference of 35.5%.
Single Mother Households Correlation Summary
| Measurement | Argentinean | Immigrants from West Indies |
| Minimum | 0.49% | 0.85% |
| Maximum | 11.1% | 12.2% |
| Range | 10.6% | 11.4% |
| Mean | 5.0% | 6.9% |
| Median | 5.2% | 7.4% |
| Interquartile 25% (IQ1) | 4.0% | 4.7% |
| Interquartile 75% (IQ3) | 5.9% | 9.2% |
| Interquartile Range (IQR) | 1.9% | 4.4% |
| Standard Deviation (Sample) | 1.8% | 3.0% |
| Standard Deviation (Population) | 1.8% | 2.9% |
Similar Demographics by Single Mother Households
Demographics Similar to Argentineans by Single Mother Households
In terms of single mother households, the demographic groups most similar to Argentineans are Tongan (5.8%, a difference of 0.020%), Belgian (5.8%, a difference of 0.080%), Immigrants from Uzbekistan (5.9%, a difference of 0.14%), Immigrants from Argentina (5.9%, a difference of 0.21%), and South African (5.8%, a difference of 0.22%).
| Demographics | Rating | Rank | Single Mother Households |
| Dutch | 95.1 /100 | #114 | Exceptional 5.8% |
| Irish | 94.8 /100 | #115 | Exceptional 5.8% |
| Pennsylvania Germans | 94.7 /100 | #116 | Exceptional 5.8% |
| Bolivians | 94.6 /100 | #117 | Exceptional 5.8% |
| Laotians | 94.3 /100 | #118 | Exceptional 5.8% |
| South Africans | 94.1 /100 | #119 | Exceptional 5.8% |
| Tongans | 93.7 /100 | #120 | Exceptional 5.8% |
| Argentineans | 93.7 /100 | #121 | Exceptional 5.8% |
| Belgians | 93.5 /100 | #122 | Exceptional 5.8% |
| Immigrants | Uzbekistan | 93.4 /100 | #123 | Exceptional 5.9% |
| Immigrants | Argentina | 93.2 /100 | #124 | Exceptional 5.9% |
| Slavs | 92.9 /100 | #125 | Exceptional 5.9% |
| Welsh | 92.8 /100 | #126 | Exceptional 5.9% |
| Lebanese | 92.4 /100 | #127 | Exceptional 5.9% |
| Czechoslovakians | 92.2 /100 | #128 | Exceptional 5.9% |
Demographics Similar to Immigrants from West Indies by Single Mother Households
In terms of single mother households, the demographic groups most similar to Immigrants from West Indies are Houma (7.9%, a difference of 0.080%), Hispanic or Latino (7.9%, a difference of 0.11%), Immigrants from Latin America (7.9%, a difference of 0.15%), Barbadian (7.9%, a difference of 0.22%), and Apache (7.9%, a difference of 0.51%).
| Demographics | Rating | Rank | Single Mother Households |
| West Indians | 0.0 /100 | #291 | Tragic 7.8% |
| Ghanaians | 0.0 /100 | #292 | Tragic 7.8% |
| Immigrants | Cameroon | 0.0 /100 | #293 | Tragic 7.9% |
| Apache | 0.0 /100 | #294 | Tragic 7.9% |
| Barbadians | 0.0 /100 | #295 | Tragic 7.9% |
| Immigrants | Latin America | 0.0 /100 | #296 | Tragic 7.9% |
| Hispanics or Latinos | 0.0 /100 | #297 | Tragic 7.9% |
| Immigrants | West Indies | 0.0 /100 | #298 | Tragic 7.9% |
| Houma | 0.0 /100 | #299 | Tragic 7.9% |
| Mexicans | 0.0 /100 | #300 | Tragic 8.0% |
| Chippewa | 0.0 /100 | #301 | Tragic 8.0% |
| Immigrants | Ghana | 0.0 /100 | #302 | Tragic 8.0% |
| Immigrants | Bahamas | 0.0 /100 | #303 | Tragic 8.0% |
| Natives/Alaskans | 0.0 /100 | #304 | Tragic 8.0% |
| Colville | 0.0 /100 | #305 | Tragic 8.0% |