Mexican American Indian vs Immigrants from Bulgaria Single Male Poverty
COMPARE
Mexican American Indian
Immigrants from Bulgaria
Single Male Poverty
Single Male Poverty Comparison
Mexican American Indians
Immigrants from Bulgaria
13.1%
SINGLE MALE POVERTY
17.5/ 100
METRIC RATING
209th/ 347
METRIC RANK
11.6%
SINGLE MALE POVERTY
99.9/ 100
METRIC RATING
46th/ 347
METRIC RANK
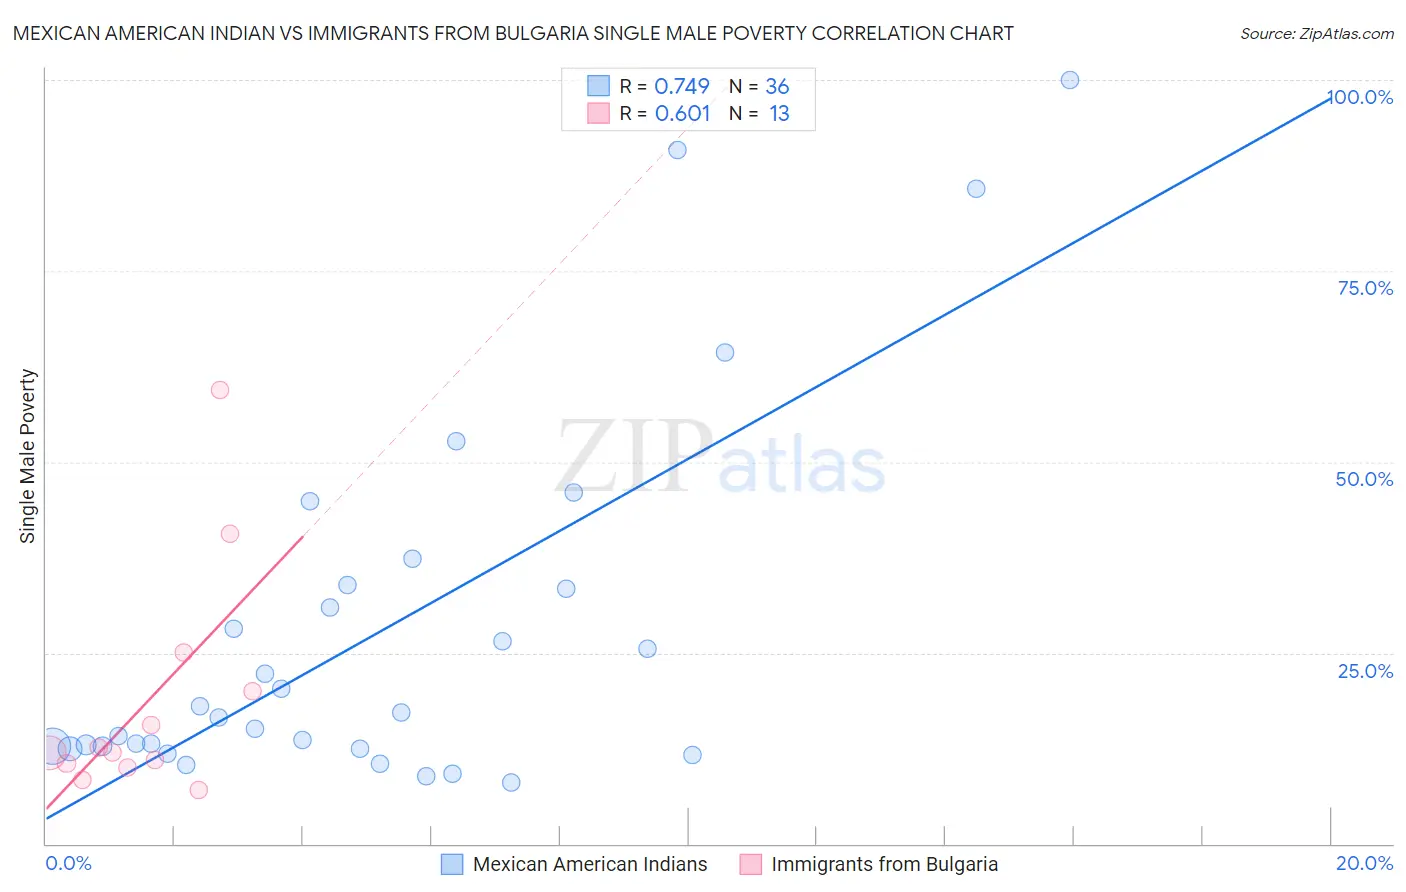
Mexican American Indian vs Immigrants from Bulgaria Single Male Poverty Correlation Chart
The statistical analysis conducted on geographies consisting of 294,400,440 people shows a strong positive correlation between the proportion of Mexican American Indians and poverty level among single males in the United States with a correlation coefficient (R) of 0.749 and weighted average of 13.1%. Similarly, the statistical analysis conducted on geographies consisting of 159,455,657 people shows a significant positive correlation between the proportion of Immigrants from Bulgaria and poverty level among single males in the United States with a correlation coefficient (R) of 0.601 and weighted average of 11.6%, a difference of 12.9%.
Single Male Poverty Correlation Summary
| Measurement | Mexican American Indian | Immigrants from Bulgaria |
| Minimum | 8.1% | 7.0% |
| Maximum | 100.0% | 59.4% |
| Range | 91.9% | 52.3% |
| Mean | 27.7% | 18.7% |
| Median | 16.8% | 11.9% |
| Interquartile 25% (IQ1) | 12.6% | 10.3% |
| Interquartile 75% (IQ3) | 33.6% | 22.5% |
| Interquartile Range (IQR) | 21.0% | 12.2% |
| Standard Deviation (Sample) | 23.9% | 15.2% |
| Standard Deviation (Population) | 23.6% | 14.6% |
Similar Demographics by Single Male Poverty
Demographics Similar to Mexican American Indians by Single Male Poverty
In terms of single male poverty, the demographic groups most similar to Mexican American Indians are Immigrants from Western Africa (13.1%, a difference of 0.010%), Sudanese (13.1%, a difference of 0.020%), Immigrants from Haiti (13.1%, a difference of 0.060%), Swedish (13.1%, a difference of 0.060%), and Senegalese (13.1%, a difference of 0.10%).
| Demographics | Rating | Rank | Single Male Poverty |
| Basques | 20.7 /100 | #202 | Fair 13.0% |
| Immigrants | Bangladesh | 20.4 /100 | #203 | Fair 13.0% |
| Estonians | 20.3 /100 | #204 | Fair 13.0% |
| Poles | 19.3 /100 | #205 | Poor 13.0% |
| Northern Europeans | 18.9 /100 | #206 | Poor 13.0% |
| Sudanese | 17.7 /100 | #207 | Poor 13.1% |
| Immigrants | Western Africa | 17.6 /100 | #208 | Poor 13.1% |
| Mexican American Indians | 17.5 /100 | #209 | Poor 13.1% |
| Immigrants | Haiti | 16.8 /100 | #210 | Poor 13.1% |
| Swedes | 16.8 /100 | #211 | Poor 13.1% |
| Senegalese | 16.4 /100 | #212 | Poor 13.1% |
| Italians | 15.9 /100 | #213 | Poor 13.1% |
| Zimbabweans | 14.9 /100 | #214 | Poor 13.1% |
| Japanese | 14.8 /100 | #215 | Poor 13.1% |
| Austrians | 13.9 /100 | #216 | Poor 13.1% |
Demographics Similar to Immigrants from Bulgaria by Single Male Poverty
In terms of single male poverty, the demographic groups most similar to Immigrants from Bulgaria are Immigrants from Poland (11.5%, a difference of 0.13%), Immigrants from Cameroon (11.5%, a difference of 0.15%), Immigrants from Peru (11.5%, a difference of 0.16%), Nepalese (11.6%, a difference of 0.20%), and Immigrants from Indonesia (11.6%, a difference of 0.27%).
| Demographics | Rating | Rank | Single Male Poverty |
| Soviet Union | 100.0 /100 | #39 | Exceptional 11.5% |
| Immigrants | Korea | 100.0 /100 | #40 | Exceptional 11.5% |
| Immigrants | Iraq | 99.9 /100 | #41 | Exceptional 11.5% |
| Egyptians | 99.9 /100 | #42 | Exceptional 11.5% |
| Immigrants | Peru | 99.9 /100 | #43 | Exceptional 11.5% |
| Immigrants | Cameroon | 99.9 /100 | #44 | Exceptional 11.5% |
| Immigrants | Poland | 99.9 /100 | #45 | Exceptional 11.5% |
| Immigrants | Bulgaria | 99.9 /100 | #46 | Exceptional 11.6% |
| Nepalese | 99.9 /100 | #47 | Exceptional 11.6% |
| Immigrants | Indonesia | 99.9 /100 | #48 | Exceptional 11.6% |
| Tlingit-Haida | 99.9 /100 | #49 | Exceptional 11.6% |
| Immigrants | Lithuania | 99.9 /100 | #50 | Exceptional 11.6% |
| Paraguayans | 99.9 /100 | #51 | Exceptional 11.6% |
| Samoans | 99.9 /100 | #52 | Exceptional 11.7% |
| Bulgarians | 99.9 /100 | #53 | Exceptional 11.7% |