Argentinean vs Cape Verdean Nursery School
COMPARE
Argentinean
Cape Verdean
Nursery School
Nursery School Comparison
Argentineans
Cape Verdeans
98.0%
NURSERY SCHOOL
46.8/ 100
METRIC RATING
179th/ 347
METRIC RANK
97.0%
NURSERY SCHOOL
0.0/ 100
METRIC RATING
314th/ 347
METRIC RANK
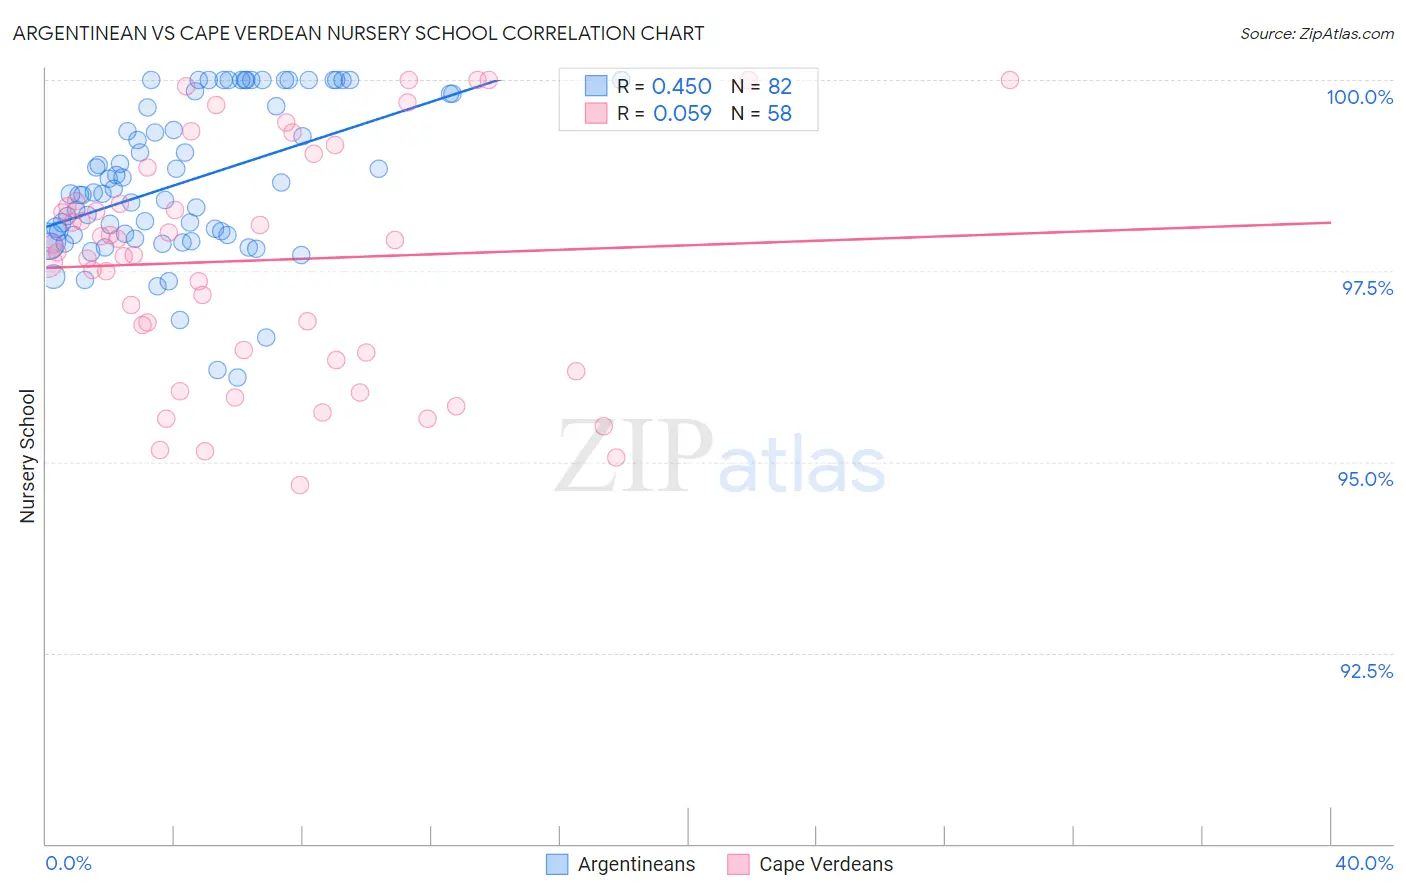
Argentinean vs Cape Verdean Nursery School Correlation Chart
The statistical analysis conducted on geographies consisting of 297,146,811 people shows a moderate positive correlation between the proportion of Argentineans and percentage of population with at least nursery school education in the United States with a correlation coefficient (R) of 0.450 and weighted average of 98.0%. Similarly, the statistical analysis conducted on geographies consisting of 107,537,955 people shows a slight positive correlation between the proportion of Cape Verdeans and percentage of population with at least nursery school education in the United States with a correlation coefficient (R) of 0.059 and weighted average of 97.0%, a difference of 1.1%.
Nursery School Correlation Summary
| Measurement | Argentinean | Cape Verdean |
| Minimum | 96.1% | 94.7% |
| Maximum | 100.0% | 100.0% |
| Range | 3.9% | 5.3% |
| Mean | 98.7% | 97.6% |
| Median | 98.5% | 97.8% |
| Interquartile 25% (IQ1) | 98.0% | 96.4% |
| Interquartile 75% (IQ3) | 99.8% | 98.4% |
| Interquartile Range (IQR) | 1.8% | 2.0% |
| Standard Deviation (Sample) | 1.00% | 1.5% |
| Standard Deviation (Population) | 0.99% | 1.5% |
Similar Demographics by Nursery School
Demographics Similar to Argentineans by Nursery School
In terms of nursery school, the demographic groups most similar to Argentineans are Immigrants from Bosnia and Herzegovina (98.0%, a difference of 0.0%), Immigrants from Brazil (98.0%, a difference of 0.010%), Kenyan (98.0%, a difference of 0.010%), Navajo (98.0%, a difference of 0.010%), and Immigrants from Sri Lanka (98.0%, a difference of 0.010%).
| Demographics | Rating | Rank | Nursery School |
| Immigrants | Brazil | 51.3 /100 | #172 | Average 98.0% |
| Kenyans | 50.2 /100 | #173 | Average 98.0% |
| Navajo | 50.0 /100 | #174 | Average 98.0% |
| Immigrants | Sri Lanka | 49.9 /100 | #175 | Average 98.0% |
| Immigrants | Venezuela | 49.8 /100 | #176 | Average 98.0% |
| Albanians | 48.9 /100 | #177 | Average 98.0% |
| Natives/Alaskans | 48.6 /100 | #178 | Average 98.0% |
| Argentineans | 46.8 /100 | #179 | Average 98.0% |
| Immigrants | Bosnia and Herzegovina | 45.6 /100 | #180 | Average 98.0% |
| Egyptians | 42.8 /100 | #181 | Average 98.0% |
| Paiute | 42.0 /100 | #182 | Average 98.0% |
| Portuguese | 41.8 /100 | #183 | Average 98.0% |
| Immigrants | Poland | 41.3 /100 | #184 | Average 98.0% |
| Immigrants | Belarus | 41.0 /100 | #185 | Average 98.0% |
| Immigrants | Argentina | 40.8 /100 | #186 | Average 98.0% |
Demographics Similar to Cape Verdeans by Nursery School
In terms of nursery school, the demographic groups most similar to Cape Verdeans are Immigrants from Nicaragua (96.9%, a difference of 0.0%), Immigrants from Belize (96.9%, a difference of 0.0%), Honduran (97.0%, a difference of 0.010%), Immigrants from Ecuador (96.9%, a difference of 0.010%), and Guyanese (97.0%, a difference of 0.030%).
| Demographics | Rating | Rank | Nursery School |
| Hispanics or Latinos | 0.0 /100 | #307 | Tragic 97.0% |
| Immigrants | Haiti | 0.0 /100 | #308 | Tragic 97.0% |
| Immigrants | Somalia | 0.0 /100 | #309 | Tragic 97.0% |
| Guyanese | 0.0 /100 | #310 | Tragic 97.0% |
| Immigrants | Azores | 0.0 /100 | #311 | Tragic 97.0% |
| Sri Lankans | 0.0 /100 | #312 | Tragic 97.0% |
| Hondurans | 0.0 /100 | #313 | Tragic 97.0% |
| Cape Verdeans | 0.0 /100 | #314 | Tragic 97.0% |
| Immigrants | Nicaragua | 0.0 /100 | #315 | Tragic 96.9% |
| Immigrants | Belize | 0.0 /100 | #316 | Tragic 96.9% |
| Immigrants | Ecuador | 0.0 /100 | #317 | Tragic 96.9% |
| Immigrants | Guyana | 0.0 /100 | #318 | Tragic 96.9% |
| Immigrants | Laos | 0.0 /100 | #319 | Tragic 96.9% |
| Immigrants | Burma/Myanmar | 0.0 /100 | #320 | Tragic 96.9% |
| Immigrants | Bangladesh | 0.0 /100 | #321 | Tragic 96.9% |