Palestinian vs Immigrants from Burma/Myanmar Single Male Poverty
COMPARE
Palestinian
Immigrants from Burma/Myanmar
Single Male Poverty
Single Male Poverty Comparison
Palestinians
Immigrants from Burma/Myanmar
12.7%
SINGLE MALE POVERTY
63.1/ 100
METRIC RATING
163rd/ 347
METRIC RANK
13.1%
SINGLE MALE POVERTY
12.6/ 100
METRIC RATING
219th/ 347
METRIC RANK
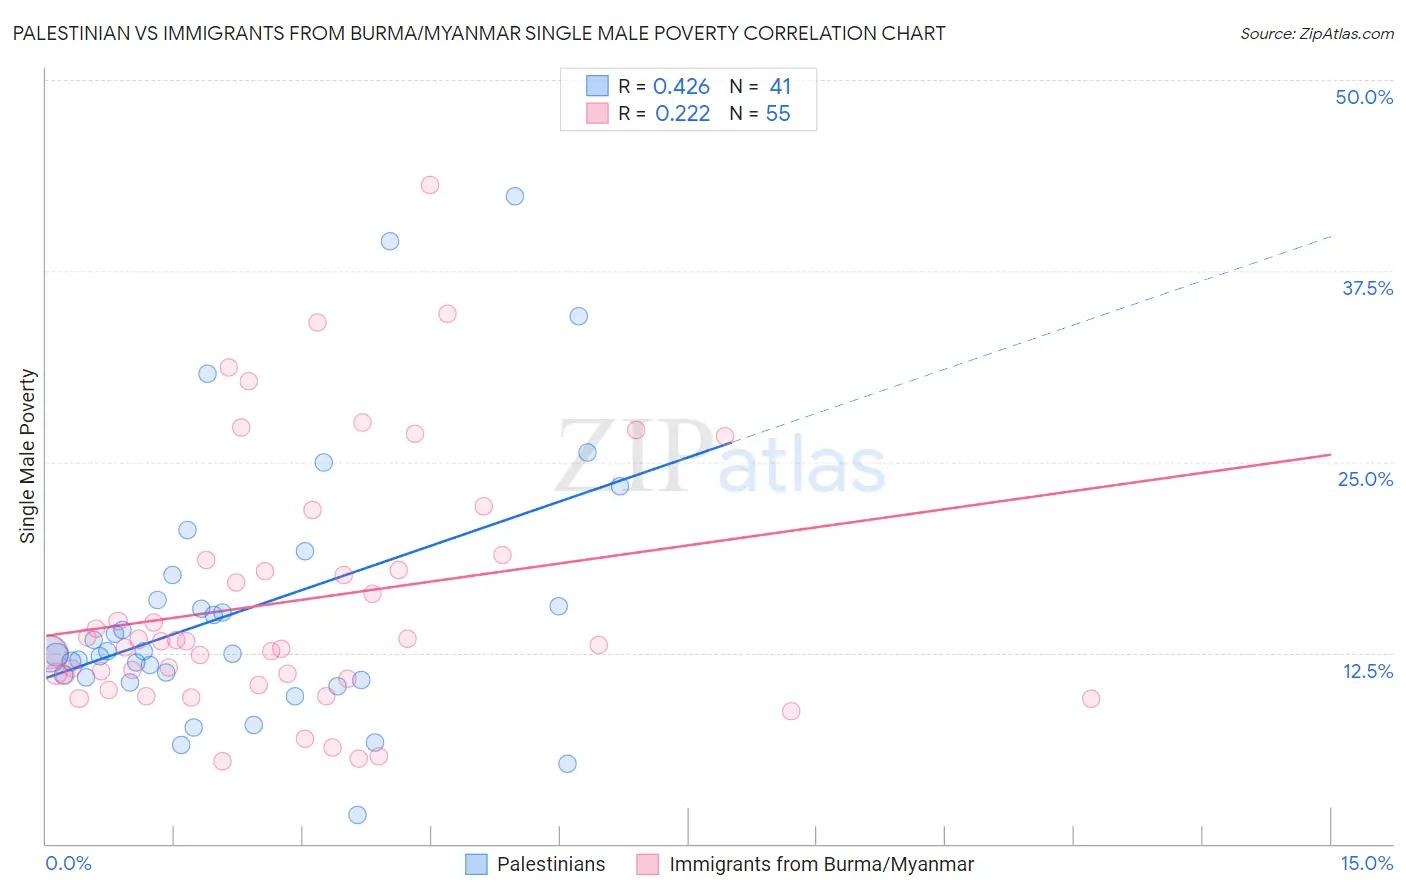
Palestinian vs Immigrants from Burma/Myanmar Single Male Poverty Correlation Chart
The statistical analysis conducted on geographies consisting of 200,638,280 people shows a moderate positive correlation between the proportion of Palestinians and poverty level among single males in the United States with a correlation coefficient (R) of 0.426 and weighted average of 12.7%. Similarly, the statistical analysis conducted on geographies consisting of 162,611,210 people shows a weak positive correlation between the proportion of Immigrants from Burma/Myanmar and poverty level among single males in the United States with a correlation coefficient (R) of 0.222 and weighted average of 13.1%, a difference of 3.3%.
Single Male Poverty Correlation Summary
| Measurement | Palestinian | Immigrants from Burma/Myanmar |
| Minimum | 1.9% | 5.4% |
| Maximum | 42.4% | 43.1% |
| Range | 40.5% | 37.7% |
| Mean | 15.3% | 15.9% |
| Median | 12.5% | 13.3% |
| Interquartile 25% (IQ1) | 10.8% | 10.8% |
| Interquartile 75% (IQ3) | 16.7% | 18.5% |
| Interquartile Range (IQR) | 5.9% | 7.8% |
| Standard Deviation (Sample) | 8.7% | 8.3% |
| Standard Deviation (Population) | 8.6% | 8.2% |
Similar Demographics by Single Male Poverty
Demographics Similar to Palestinians by Single Male Poverty
In terms of single male poverty, the demographic groups most similar to Palestinians are Eastern European (12.7%, a difference of 0.010%), Immigrants from Nigeria (12.7%, a difference of 0.010%), Immigrants from Africa (12.7%, a difference of 0.020%), Immigrants from Cambodia (12.7%, a difference of 0.050%), and Immigrants from Liberia (12.7%, a difference of 0.060%).
| Demographics | Rating | Rank | Single Male Poverty |
| Vietnamese | 67.9 /100 | #156 | Good 12.7% |
| Latvians | 67.9 /100 | #157 | Good 12.7% |
| Immigrants | Middle Africa | 64.9 /100 | #158 | Good 12.7% |
| Immigrants | Liberia | 64.2 /100 | #159 | Good 12.7% |
| Greeks | 64.1 /100 | #160 | Good 12.7% |
| Immigrants | Africa | 63.4 /100 | #161 | Good 12.7% |
| Eastern Europeans | 63.3 /100 | #162 | Good 12.7% |
| Palestinians | 63.1 /100 | #163 | Good 12.7% |
| Immigrants | Nigeria | 62.8 /100 | #164 | Good 12.7% |
| Immigrants | Cambodia | 62.2 /100 | #165 | Good 12.7% |
| Immigrants | Guyana | 60.5 /100 | #166 | Good 12.7% |
| Immigrants | Sudan | 58.2 /100 | #167 | Average 12.7% |
| Immigrants | Barbados | 57.7 /100 | #168 | Average 12.7% |
| Puget Sound Salish | 54.3 /100 | #169 | Average 12.8% |
| Guyanese | 52.0 /100 | #170 | Average 12.8% |
Demographics Similar to Immigrants from Burma/Myanmar by Single Male Poverty
In terms of single male poverty, the demographic groups most similar to Immigrants from Burma/Myanmar are Scandinavian (13.1%, a difference of 0.030%), Bermudan (13.1%, a difference of 0.050%), Austrian (13.1%, a difference of 0.15%), Central American (13.2%, a difference of 0.22%), and Japanese (13.1%, a difference of 0.24%).
| Demographics | Rating | Rank | Single Male Poverty |
| Senegalese | 16.4 /100 | #212 | Poor 13.1% |
| Italians | 15.9 /100 | #213 | Poor 13.1% |
| Zimbabweans | 14.9 /100 | #214 | Poor 13.1% |
| Japanese | 14.8 /100 | #215 | Poor 13.1% |
| Austrians | 13.9 /100 | #216 | Poor 13.1% |
| Bermudans | 13.0 /100 | #217 | Poor 13.1% |
| Scandinavians | 12.9 /100 | #218 | Poor 13.1% |
| Immigrants | Burma/Myanmar | 12.6 /100 | #219 | Poor 13.1% |
| Central Americans | 10.9 /100 | #220 | Poor 13.2% |
| New Zealanders | 10.7 /100 | #221 | Poor 13.2% |
| Immigrants | Western Europe | 10.0 /100 | #222 | Poor 13.2% |
| Immigrants | Azores | 9.3 /100 | #223 | Tragic 13.2% |
| Somalis | 9.1 /100 | #224 | Tragic 13.2% |
| Immigrants | Denmark | 8.7 /100 | #225 | Tragic 13.2% |
| Jamaicans | 7.7 /100 | #226 | Tragic 13.2% |