Arab vs Immigrants from Serbia Female Poverty Among 18-24 Year Olds
COMPARE
Arab
Immigrants from Serbia
Female Poverty Among 18-24 Year Olds
Female Poverty Among 18-24 Year Olds Comparison
Arabs
Immigrants from Serbia
20.5%
FEMALE POVERTY AMONG 18-24 YEAR OLDS
15.5/ 100
METRIC RATING
209th/ 347
METRIC RANK
19.2%
FEMALE POVERTY AMONG 18-24 YEAR OLDS
97.1/ 100
METRIC RATING
111th/ 347
METRIC RANK
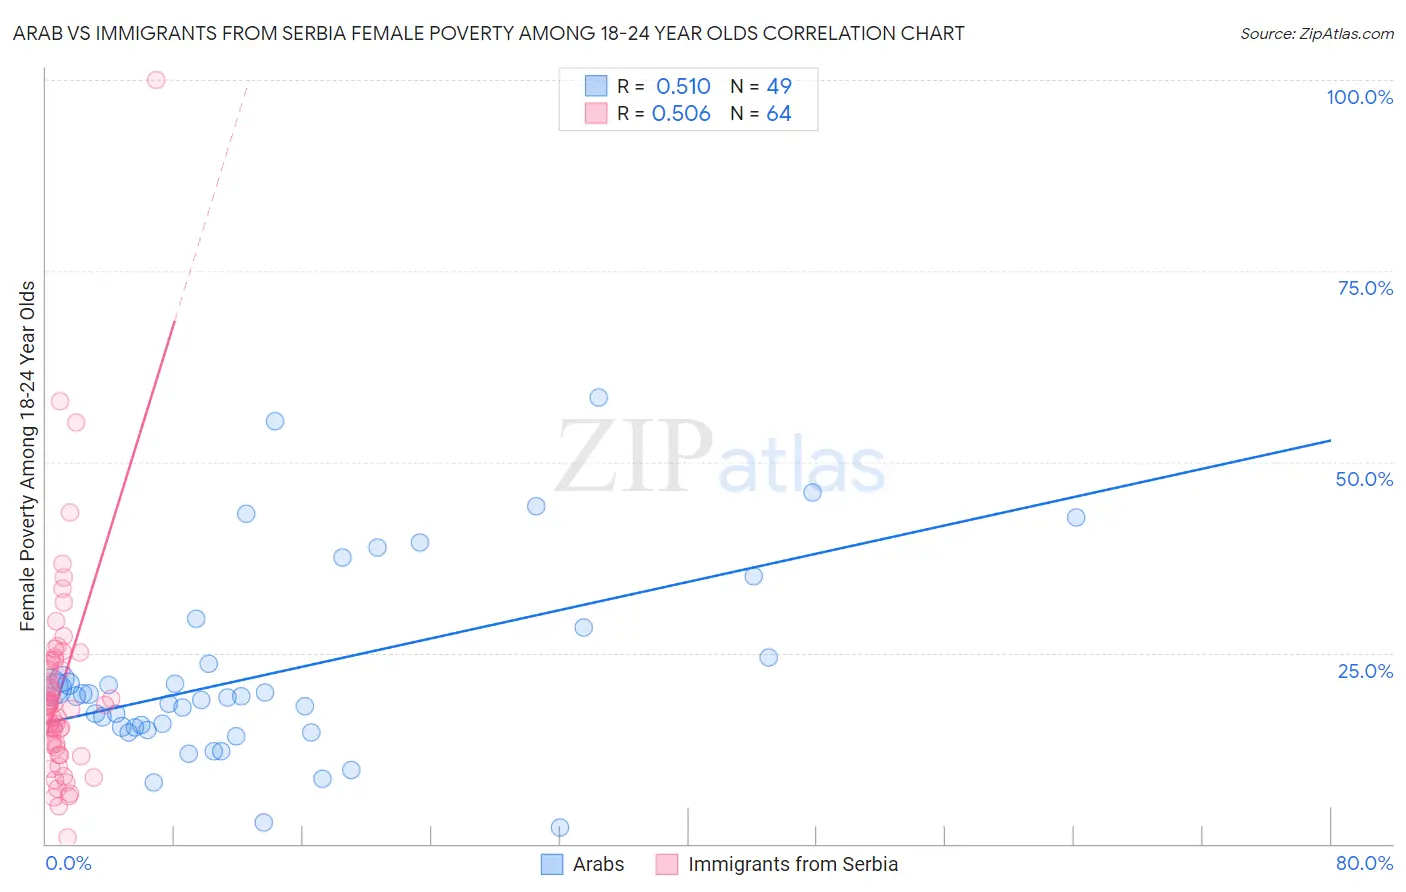
Arab vs Immigrants from Serbia Female Poverty Among 18-24 Year Olds Correlation Chart
The statistical analysis conducted on geographies consisting of 469,243,269 people shows a substantial positive correlation between the proportion of Arabs and poverty level among females between the ages 18 and 24 in the United States with a correlation coefficient (R) of 0.510 and weighted average of 20.5%. Similarly, the statistical analysis conducted on geographies consisting of 130,475,309 people shows a substantial positive correlation between the proportion of Immigrants from Serbia and poverty level among females between the ages 18 and 24 in the United States with a correlation coefficient (R) of 0.506 and weighted average of 19.2%, a difference of 6.6%.
Female Poverty Among 18-24 Year Olds Correlation Summary
| Measurement | Arab | Immigrants from Serbia |
| Minimum | 2.1% | 0.90% |
| Maximum | 58.5% | 100.0% |
| Range | 56.4% | 99.1% |
| Mean | 22.4% | 20.4% |
| Median | 19.3% | 18.2% |
| Interquartile 25% (IQ1) | 15.0% | 12.8% |
| Interquartile 75% (IQ3) | 26.3% | 24.0% |
| Interquartile Range (IQR) | 11.3% | 11.2% |
| Standard Deviation (Sample) | 12.6% | 14.6% |
| Standard Deviation (Population) | 12.5% | 14.5% |
Similar Demographics by Female Poverty Among 18-24 Year Olds
Demographics Similar to Arabs by Female Poverty Among 18-24 Year Olds
In terms of female poverty among 18-24 year olds, the demographic groups most similar to Arabs are Dutch (20.5%, a difference of 0.030%), Spaniard (20.5%, a difference of 0.070%), English (20.5%, a difference of 0.10%), Hispanic or Latino (20.5%, a difference of 0.10%), and Immigrants from Ghana (20.5%, a difference of 0.11%).
| Demographics | Rating | Rank | Female Poverty Among 18-24 Year Olds |
| Immigrants | Turkey | 17.7 /100 | #202 | Poor 20.5% |
| Immigrants | Malaysia | 17.2 /100 | #203 | Poor 20.5% |
| Immigrants | Netherlands | 17.0 /100 | #204 | Poor 20.5% |
| English | 16.7 /100 | #205 | Poor 20.5% |
| Hispanics or Latinos | 16.6 /100 | #206 | Poor 20.5% |
| Spaniards | 16.3 /100 | #207 | Poor 20.5% |
| Dutch | 15.9 /100 | #208 | Poor 20.5% |
| Arabs | 15.5 /100 | #209 | Poor 20.5% |
| Immigrants | Ghana | 14.3 /100 | #210 | Poor 20.5% |
| Immigrants | Western Europe | 13.5 /100 | #211 | Poor 20.6% |
| Liberians | 11.6 /100 | #212 | Poor 20.6% |
| Northern Europeans | 11.6 /100 | #213 | Poor 20.6% |
| Immigrants | South Africa | 10.7 /100 | #214 | Poor 20.6% |
| Spanish | 10.4 /100 | #215 | Poor 20.6% |
| Immigrants | Western Africa | 10.2 /100 | #216 | Poor 20.6% |
Demographics Similar to Immigrants from Serbia by Female Poverty Among 18-24 Year Olds
In terms of female poverty among 18-24 year olds, the demographic groups most similar to Immigrants from Serbia are Laotian (19.2%, a difference of 0.020%), Immigrants from Syria (19.2%, a difference of 0.040%), Immigrants from Uzbekistan (19.2%, a difference of 0.12%), Immigrants from Sri Lanka (19.2%, a difference of 0.22%), and Immigrants from El Salvador (19.3%, a difference of 0.23%).
| Demographics | Rating | Rank | Female Poverty Among 18-24 Year Olds |
| Immigrants | Afghanistan | 98.0 /100 | #104 | Exceptional 19.1% |
| Immigrants | Ecuador | 97.8 /100 | #105 | Exceptional 19.2% |
| Immigrants | Sierra Leone | 97.8 /100 | #106 | Exceptional 19.2% |
| Immigrants | Sri Lanka | 97.5 /100 | #107 | Exceptional 19.2% |
| Immigrants | Uzbekistan | 97.3 /100 | #108 | Exceptional 19.2% |
| Immigrants | Syria | 97.2 /100 | #109 | Exceptional 19.2% |
| Laotians | 97.1 /100 | #110 | Exceptional 19.2% |
| Immigrants | Serbia | 97.1 /100 | #111 | Exceptional 19.2% |
| Immigrants | El Salvador | 96.5 /100 | #112 | Exceptional 19.3% |
| Immigrants | Cameroon | 96.3 /100 | #113 | Exceptional 19.3% |
| Slovenes | 96.2 /100 | #114 | Exceptional 19.3% |
| Immigrants | Hungary | 96.2 /100 | #115 | Exceptional 19.3% |
| Immigrants | Immigrants | 95.9 /100 | #116 | Exceptional 19.3% |
| Immigrants | Iran | 95.8 /100 | #117 | Exceptional 19.3% |
| Immigrants | Guyana | 95.6 /100 | #118 | Exceptional 19.3% |