Belgian vs Turkish Female Poverty Among 18-24 Year Olds
COMPARE
Belgian
Turkish
Female Poverty Among 18-24 Year Olds
Female Poverty Among 18-24 Year Olds Comparison
Belgians
Turks
19.9%
FEMALE POVERTY AMONG 18-24 YEAR OLDS
69.1/ 100
METRIC RATING
166th/ 347
METRIC RANK
19.5%
FEMALE POVERTY AMONG 18-24 YEAR OLDS
92.1/ 100
METRIC RATING
133rd/ 347
METRIC RANK
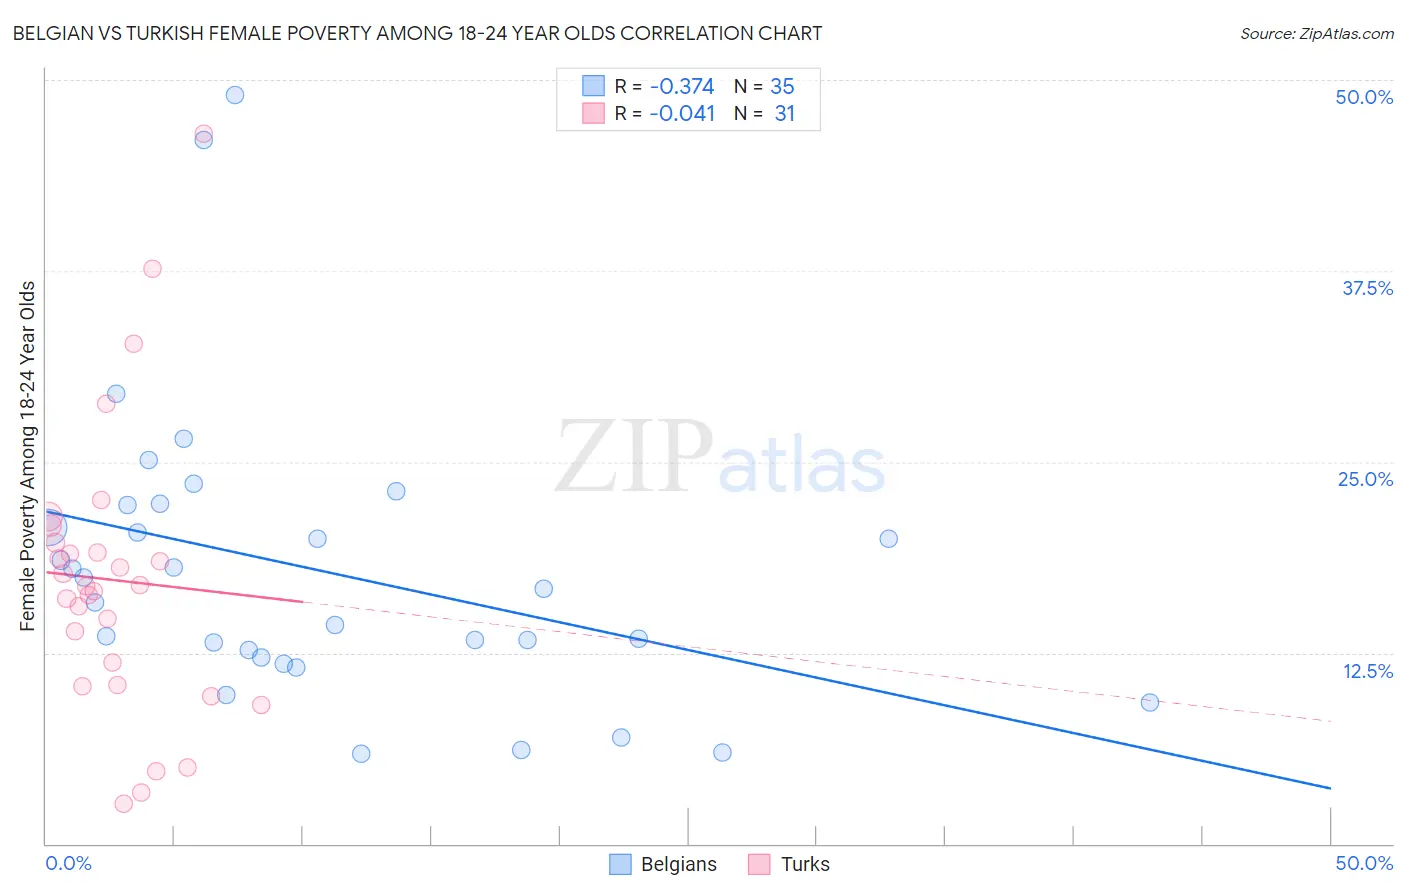
Belgian vs Turkish Female Poverty Among 18-24 Year Olds Correlation Chart
The statistical analysis conducted on geographies consisting of 345,924,270 people shows a mild negative correlation between the proportion of Belgians and poverty level among females between the ages 18 and 24 in the United States with a correlation coefficient (R) of -0.374 and weighted average of 19.9%. Similarly, the statistical analysis conducted on geographies consisting of 266,666,868 people shows no correlation between the proportion of Turks and poverty level among females between the ages 18 and 24 in the United States with a correlation coefficient (R) of -0.041 and weighted average of 19.5%, a difference of 2.1%.
Female Poverty Among 18-24 Year Olds Correlation Summary
| Measurement | Belgian | Turkish |
| Minimum | 5.9% | 2.6% |
| Maximum | 49.0% | 46.5% |
| Range | 43.1% | 43.9% |
| Mean | 17.9% | 17.3% |
| Median | 16.7% | 16.9% |
| Interquartile 25% (IQ1) | 12.2% | 10.4% |
| Interquartile 75% (IQ3) | 22.2% | 19.7% |
| Interquartile Range (IQR) | 10.0% | 9.3% |
| Standard Deviation (Sample) | 9.5% | 9.5% |
| Standard Deviation (Population) | 9.4% | 9.3% |
Similar Demographics by Female Poverty Among 18-24 Year Olds
Demographics Similar to Belgians by Female Poverty Among 18-24 Year Olds
In terms of female poverty among 18-24 year olds, the demographic groups most similar to Belgians are Eastern European (19.9%, a difference of 0.010%), Central American (19.9%, a difference of 0.050%), Malaysian (19.9%, a difference of 0.21%), French Canadian (19.9%, a difference of 0.24%), and Immigrants from Belize (19.8%, a difference of 0.30%).
| Demographics | Rating | Rank | Female Poverty Among 18-24 Year Olds |
| Trinidadians and Tobagonians | 74.4 /100 | #159 | Good 19.8% |
| Pakistanis | 74.1 /100 | #160 | Good 19.8% |
| Immigrants | Belize | 74.1 /100 | #161 | Good 19.8% |
| French Canadians | 73.0 /100 | #162 | Good 19.9% |
| Malaysians | 72.7 /100 | #163 | Good 19.9% |
| Central Americans | 70.0 /100 | #164 | Good 19.9% |
| Eastern Europeans | 69.3 /100 | #165 | Good 19.9% |
| Belgians | 69.1 /100 | #166 | Good 19.9% |
| Czechoslovakians | 61.8 /100 | #167 | Good 20.0% |
| Fijians | 59.1 /100 | #168 | Average 20.0% |
| Hmong | 55.4 /100 | #169 | Average 20.0% |
| Iranians | 54.7 /100 | #170 | Average 20.1% |
| Immigrants | Nigeria | 54.3 /100 | #171 | Average 20.1% |
| Belizeans | 52.0 /100 | #172 | Average 20.1% |
| Irish | 50.0 /100 | #173 | Average 20.1% |
Demographics Similar to Turks by Female Poverty Among 18-24 Year Olds
In terms of female poverty among 18-24 year olds, the demographic groups most similar to Turks are Jamaican (19.5%, a difference of 0.0%), Immigrants from North America (19.5%, a difference of 0.010%), Soviet Union (19.5%, a difference of 0.020%), Latvian (19.5%, a difference of 0.11%), and Russian (19.5%, a difference of 0.11%).
| Demographics | Rating | Rank | Female Poverty Among 18-24 Year Olds |
| Immigrants | Russia | 93.7 /100 | #126 | Exceptional 19.4% |
| Cape Verdeans | 93.6 /100 | #127 | Exceptional 19.4% |
| Slovaks | 92.9 /100 | #128 | Exceptional 19.5% |
| Immigrants | England | 92.9 /100 | #129 | Exceptional 19.5% |
| Immigrants | Canada | 92.9 /100 | #130 | Exceptional 19.5% |
| Latvians | 92.7 /100 | #131 | Exceptional 19.5% |
| Jamaicans | 92.1 /100 | #132 | Exceptional 19.5% |
| Turks | 92.1 /100 | #133 | Exceptional 19.5% |
| Immigrants | North America | 92.1 /100 | #134 | Exceptional 19.5% |
| Soviet Union | 92.0 /100 | #135 | Exceptional 19.5% |
| Russians | 91.5 /100 | #136 | Exceptional 19.5% |
| Austrians | 90.7 /100 | #137 | Exceptional 19.5% |
| Immigrants | Morocco | 89.9 /100 | #138 | Excellent 19.6% |
| Indians (Asian) | 88.3 /100 | #139 | Excellent 19.6% |
| Immigrants | Trinidad and Tobago | 85.6 /100 | #140 | Excellent 19.7% |