Arab vs Samoan Female Poverty Among 18-24 Year Olds
COMPARE
Arab
Samoan
Female Poverty Among 18-24 Year Olds
Female Poverty Among 18-24 Year Olds Comparison
Arabs
Samoans
20.5%
FEMALE POVERTY AMONG 18-24 YEAR OLDS
15.5/ 100
METRIC RATING
209th/ 347
METRIC RANK
18.2%
FEMALE POVERTY AMONG 18-24 YEAR OLDS
100.0/ 100
METRIC RATING
50th/ 347
METRIC RANK
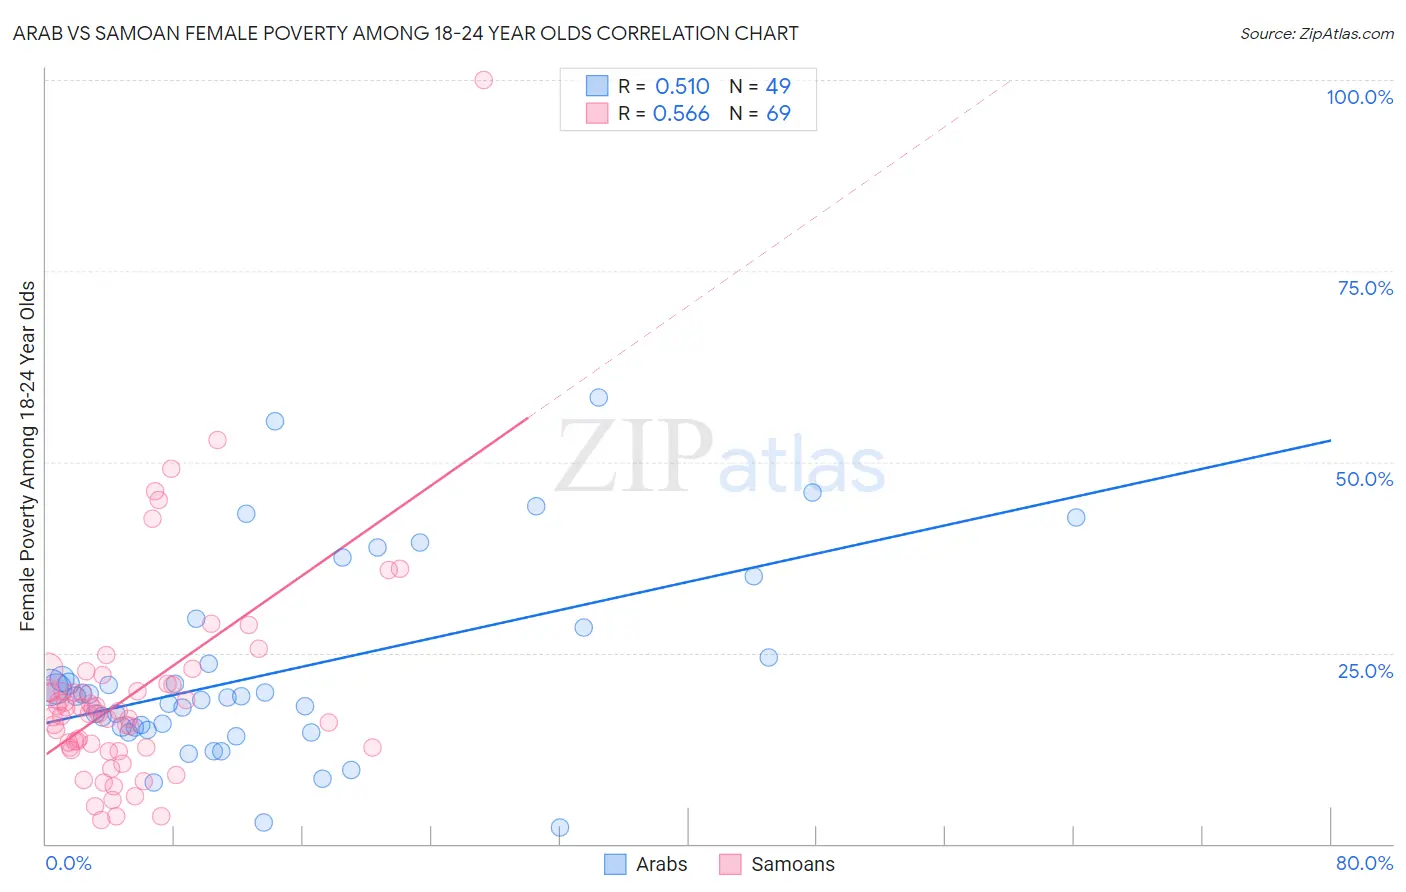
Arab vs Samoan Female Poverty Among 18-24 Year Olds Correlation Chart
The statistical analysis conducted on geographies consisting of 469,243,269 people shows a substantial positive correlation between the proportion of Arabs and poverty level among females between the ages 18 and 24 in the United States with a correlation coefficient (R) of 0.510 and weighted average of 20.5%. Similarly, the statistical analysis conducted on geographies consisting of 223,050,884 people shows a substantial positive correlation between the proportion of Samoans and poverty level among females between the ages 18 and 24 in the United States with a correlation coefficient (R) of 0.566 and weighted average of 18.2%, a difference of 12.6%.
Female Poverty Among 18-24 Year Olds Correlation Summary
| Measurement | Arab | Samoan |
| Minimum | 2.1% | 3.1% |
| Maximum | 58.5% | 100.0% |
| Range | 56.4% | 96.9% |
| Mean | 22.4% | 19.6% |
| Median | 19.3% | 17.1% |
| Interquartile 25% (IQ1) | 15.0% | 12.6% |
| Interquartile 75% (IQ3) | 26.3% | 20.9% |
| Interquartile Range (IQR) | 11.3% | 8.3% |
| Standard Deviation (Sample) | 12.6% | 14.3% |
| Standard Deviation (Population) | 12.5% | 14.2% |
Similar Demographics by Female Poverty Among 18-24 Year Olds
Demographics Similar to Arabs by Female Poverty Among 18-24 Year Olds
In terms of female poverty among 18-24 year olds, the demographic groups most similar to Arabs are Dutch (20.5%, a difference of 0.030%), Spaniard (20.5%, a difference of 0.070%), English (20.5%, a difference of 0.10%), Hispanic or Latino (20.5%, a difference of 0.10%), and Immigrants from Ghana (20.5%, a difference of 0.11%).
| Demographics | Rating | Rank | Female Poverty Among 18-24 Year Olds |
| Immigrants | Turkey | 17.7 /100 | #202 | Poor 20.5% |
| Immigrants | Malaysia | 17.2 /100 | #203 | Poor 20.5% |
| Immigrants | Netherlands | 17.0 /100 | #204 | Poor 20.5% |
| English | 16.7 /100 | #205 | Poor 20.5% |
| Hispanics or Latinos | 16.6 /100 | #206 | Poor 20.5% |
| Spaniards | 16.3 /100 | #207 | Poor 20.5% |
| Dutch | 15.9 /100 | #208 | Poor 20.5% |
| Arabs | 15.5 /100 | #209 | Poor 20.5% |
| Immigrants | Ghana | 14.3 /100 | #210 | Poor 20.5% |
| Immigrants | Western Europe | 13.5 /100 | #211 | Poor 20.6% |
| Liberians | 11.6 /100 | #212 | Poor 20.6% |
| Northern Europeans | 11.6 /100 | #213 | Poor 20.6% |
| Immigrants | South Africa | 10.7 /100 | #214 | Poor 20.6% |
| Spanish | 10.4 /100 | #215 | Poor 20.6% |
| Immigrants | Western Africa | 10.2 /100 | #216 | Poor 20.6% |
Demographics Similar to Samoans by Female Poverty Among 18-24 Year Olds
In terms of female poverty among 18-24 year olds, the demographic groups most similar to Samoans are Bhutanese (18.2%, a difference of 0.11%), Sri Lankan (18.2%, a difference of 0.14%), Immigrants from Eastern Europe (18.2%, a difference of 0.17%), Asian (18.2%, a difference of 0.19%), and Immigrants from Southern Europe (18.2%, a difference of 0.27%).
| Demographics | Rating | Rank | Female Poverty Among 18-24 Year Olds |
| Macedonians | 100.0 /100 | #43 | Exceptional 18.1% |
| Nicaraguans | 100.0 /100 | #44 | Exceptional 18.1% |
| Spanish American Indians | 100.0 /100 | #45 | Exceptional 18.1% |
| Immigrants | Southern Europe | 100.0 /100 | #46 | Exceptional 18.2% |
| Asians | 100.0 /100 | #47 | Exceptional 18.2% |
| Sri Lankans | 100.0 /100 | #48 | Exceptional 18.2% |
| Bhutanese | 100.0 /100 | #49 | Exceptional 18.2% |
| Samoans | 100.0 /100 | #50 | Exceptional 18.2% |
| Immigrants | Eastern Europe | 99.9 /100 | #51 | Exceptional 18.2% |
| Immigrants | Ireland | 99.9 /100 | #52 | Exceptional 18.3% |
| Italians | 99.9 /100 | #53 | Exceptional 18.3% |
| Immigrants | Egypt | 99.9 /100 | #54 | Exceptional 18.4% |
| Albanians | 99.9 /100 | #55 | Exceptional 18.4% |
| Argentineans | 99.9 /100 | #56 | Exceptional 18.4% |
| Immigrants | Italy | 99.9 /100 | #57 | Exceptional 18.4% |