Arab vs Immigrants from Somalia Female Poverty Among 18-24 Year Olds
COMPARE
Arab
Immigrants from Somalia
Female Poverty Among 18-24 Year Olds
Female Poverty Among 18-24 Year Olds Comparison
Arabs
Immigrants from Somalia
20.5%
FEMALE POVERTY AMONG 18-24 YEAR OLDS
15.5/ 100
METRIC RATING
209th/ 347
METRIC RANK
25.7%
FEMALE POVERTY AMONG 18-24 YEAR OLDS
0.0/ 100
METRIC RATING
330th/ 347
METRIC RANK
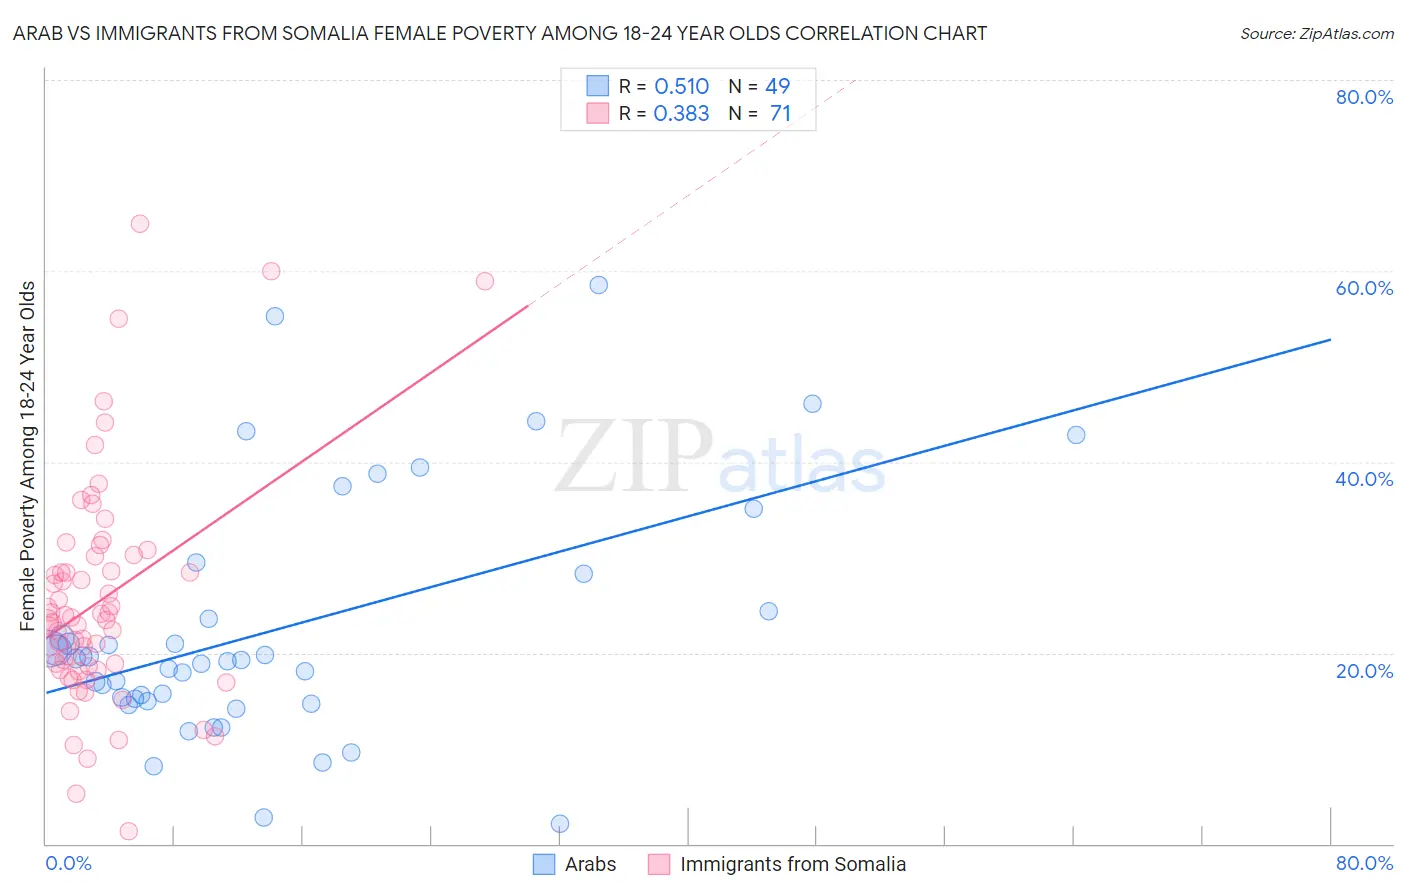
Arab vs Immigrants from Somalia Female Poverty Among 18-24 Year Olds Correlation Chart
The statistical analysis conducted on geographies consisting of 469,243,269 people shows a substantial positive correlation between the proportion of Arabs and poverty level among females between the ages 18 and 24 in the United States with a correlation coefficient (R) of 0.510 and weighted average of 20.5%. Similarly, the statistical analysis conducted on geographies consisting of 91,805,813 people shows a mild positive correlation between the proportion of Immigrants from Somalia and poverty level among females between the ages 18 and 24 in the United States with a correlation coefficient (R) of 0.383 and weighted average of 25.7%, a difference of 25.5%.
Female Poverty Among 18-24 Year Olds Correlation Summary
| Measurement | Arab | Immigrants from Somalia |
| Minimum | 2.1% | 1.4% |
| Maximum | 58.5% | 65.0% |
| Range | 56.4% | 63.6% |
| Mean | 22.4% | 25.5% |
| Median | 19.3% | 23.4% |
| Interquartile 25% (IQ1) | 15.0% | 18.3% |
| Interquartile 75% (IQ3) | 26.3% | 30.1% |
| Interquartile Range (IQR) | 11.3% | 11.8% |
| Standard Deviation (Sample) | 12.6% | 11.9% |
| Standard Deviation (Population) | 12.5% | 11.8% |
Similar Demographics by Female Poverty Among 18-24 Year Olds
Demographics Similar to Arabs by Female Poverty Among 18-24 Year Olds
In terms of female poverty among 18-24 year olds, the demographic groups most similar to Arabs are Dutch (20.5%, a difference of 0.030%), Spaniard (20.5%, a difference of 0.070%), English (20.5%, a difference of 0.10%), Hispanic or Latino (20.5%, a difference of 0.10%), and Immigrants from Ghana (20.5%, a difference of 0.11%).
| Demographics | Rating | Rank | Female Poverty Among 18-24 Year Olds |
| Immigrants | Turkey | 17.7 /100 | #202 | Poor 20.5% |
| Immigrants | Malaysia | 17.2 /100 | #203 | Poor 20.5% |
| Immigrants | Netherlands | 17.0 /100 | #204 | Poor 20.5% |
| English | 16.7 /100 | #205 | Poor 20.5% |
| Hispanics or Latinos | 16.6 /100 | #206 | Poor 20.5% |
| Spaniards | 16.3 /100 | #207 | Poor 20.5% |
| Dutch | 15.9 /100 | #208 | Poor 20.5% |
| Arabs | 15.5 /100 | #209 | Poor 20.5% |
| Immigrants | Ghana | 14.3 /100 | #210 | Poor 20.5% |
| Immigrants | Western Europe | 13.5 /100 | #211 | Poor 20.6% |
| Liberians | 11.6 /100 | #212 | Poor 20.6% |
| Northern Europeans | 11.6 /100 | #213 | Poor 20.6% |
| Immigrants | South Africa | 10.7 /100 | #214 | Poor 20.6% |
| Spanish | 10.4 /100 | #215 | Poor 20.6% |
| Immigrants | Western Africa | 10.2 /100 | #216 | Poor 20.6% |
Demographics Similar to Immigrants from Somalia by Female Poverty Among 18-24 Year Olds
In terms of female poverty among 18-24 year olds, the demographic groups most similar to Immigrants from Somalia are Cajun (25.7%, a difference of 0.21%), Chippewa (25.9%, a difference of 0.65%), Native/Alaskan (25.4%, a difference of 1.3%), Ute (25.4%, a difference of 1.4%), and Yakama (25.3%, a difference of 1.6%).
| Demographics | Rating | Rank | Female Poverty Among 18-24 Year Olds |
| Arapaho | 0.0 /100 | #323 | Tragic 25.2% |
| German Russians | 0.0 /100 | #324 | Tragic 25.2% |
| Immigrants | Saudi Arabia | 0.0 /100 | #325 | Tragic 25.3% |
| Yakama | 0.0 /100 | #326 | Tragic 25.3% |
| Ute | 0.0 /100 | #327 | Tragic 25.4% |
| Natives/Alaskans | 0.0 /100 | #328 | Tragic 25.4% |
| Cajuns | 0.0 /100 | #329 | Tragic 25.7% |
| Immigrants | Somalia | 0.0 /100 | #330 | Tragic 25.7% |
| Chippewa | 0.0 /100 | #331 | Tragic 25.9% |
| Houma | 0.0 /100 | #332 | Tragic 26.2% |
| Apache | 0.0 /100 | #333 | Tragic 26.3% |
| Pueblo | 0.0 /100 | #334 | Tragic 26.9% |
| Yup'ik | 0.0 /100 | #335 | Tragic 27.0% |
| Immigrants | Yemen | 0.0 /100 | #336 | Tragic 27.5% |
| Cheyenne | 0.0 /100 | #337 | Tragic 28.1% |