Immigrants from the Azores vs Japanese Single Male Poverty
COMPARE
Immigrants from the Azores
Japanese
Single Male Poverty
Single Male Poverty Comparison
Immigrants from the Azores
Japanese
13.2%
SINGLE MALE POVERTY
9.3/ 100
METRIC RATING
223rd/ 347
METRIC RANK
13.1%
SINGLE MALE POVERTY
14.8/ 100
METRIC RATING
215th/ 347
METRIC RANK
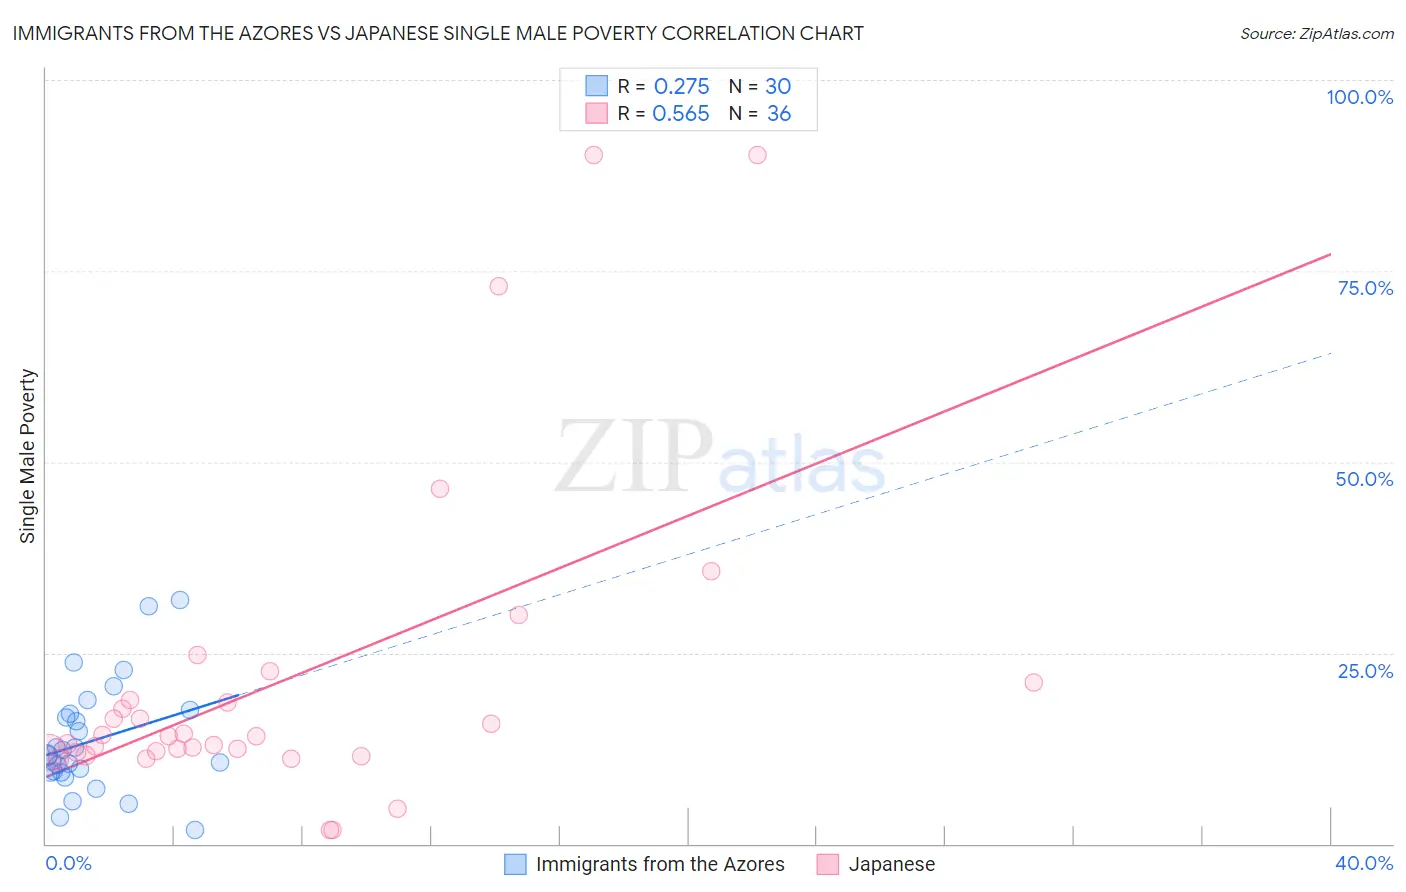
Immigrants from the Azores vs Japanese Single Male Poverty Correlation Chart
The statistical analysis conducted on geographies consisting of 43,584,475 people shows a weak positive correlation between the proportion of Immigrants from the Azores and poverty level among single males in the United States with a correlation coefficient (R) of 0.275 and weighted average of 13.2%. Similarly, the statistical analysis conducted on geographies consisting of 231,157,970 people shows a substantial positive correlation between the proportion of Japanese and poverty level among single males in the United States with a correlation coefficient (R) of 0.565 and weighted average of 13.1%, a difference of 0.69%.
Single Male Poverty Correlation Summary
| Measurement | Immigrants from the Azores | Japanese |
| Minimum | 1.7% | 1.7% |
| Maximum | 31.9% | 90.1% |
| Range | 30.2% | 88.4% |
| Mean | 13.5% | 21.4% |
| Median | 11.6% | 14.1% |
| Interquartile 25% (IQ1) | 9.3% | 12.0% |
| Interquartile 75% (IQ3) | 17.1% | 20.0% |
| Interquartile Range (IQR) | 7.8% | 8.0% |
| Standard Deviation (Sample) | 7.2% | 21.1% |
| Standard Deviation (Population) | 7.1% | 20.8% |
Demographics Similar to Immigrants from the Azores and Japanese by Single Male Poverty
In terms of single male poverty, the demographic groups most similar to Immigrants from the Azores are Somali (13.2%, a difference of 0.030%), Immigrants from Denmark (13.2%, a difference of 0.090%), Immigrants from Western Europe (13.2%, a difference of 0.11%), New Zealander (13.2%, a difference of 0.20%), and Central American (13.2%, a difference of 0.23%). Similarly, the demographic groups most similar to Japanese are Zimbabwean (13.1%, a difference of 0.010%), Austrian (13.1%, a difference of 0.090%), Italian (13.1%, a difference of 0.11%), Senegalese (13.1%, a difference of 0.16%), and Swedish (13.1%, a difference of 0.19%).
| Demographics | Rating | Rank | Single Male Poverty |
| Mexican American Indians | 17.5 /100 | #209 | Poor 13.1% |
| Immigrants | Haiti | 16.8 /100 | #210 | Poor 13.1% |
| Swedes | 16.8 /100 | #211 | Poor 13.1% |
| Senegalese | 16.4 /100 | #212 | Poor 13.1% |
| Italians | 15.9 /100 | #213 | Poor 13.1% |
| Zimbabweans | 14.9 /100 | #214 | Poor 13.1% |
| Japanese | 14.8 /100 | #215 | Poor 13.1% |
| Austrians | 13.9 /100 | #216 | Poor 13.1% |
| Bermudans | 13.0 /100 | #217 | Poor 13.1% |
| Scandinavians | 12.9 /100 | #218 | Poor 13.1% |
| Immigrants | Burma/Myanmar | 12.6 /100 | #219 | Poor 13.1% |
| Central Americans | 10.9 /100 | #220 | Poor 13.2% |
| New Zealanders | 10.7 /100 | #221 | Poor 13.2% |
| Immigrants | Western Europe | 10.0 /100 | #222 | Poor 13.2% |
| Immigrants | Azores | 9.3 /100 | #223 | Tragic 13.2% |
| Somalis | 9.1 /100 | #224 | Tragic 13.2% |
| Immigrants | Denmark | 8.7 /100 | #225 | Tragic 13.2% |
| Jamaicans | 7.7 /100 | #226 | Tragic 13.2% |
| Haitians | 7.0 /100 | #227 | Tragic 13.2% |
| Lebanese | 6.6 /100 | #228 | Tragic 13.2% |
| Europeans | 6.2 /100 | #229 | Tragic 13.3% |