Austrian vs Indonesian Child Poverty Under the Age of 5
COMPARE
Austrian
Indonesian
Child Poverty Under the Age of 5
Child Poverty Under the Age of 5 Comparison
Austrians
Indonesians
16.1%
CHILD POVERTY UNDER THE AGE OF 5
92.0/ 100
METRIC RATING
123rd/ 347
METRIC RANK
22.3%
CHILD POVERTY UNDER THE AGE OF 5
0.0/ 100
METRIC RATING
306th/ 347
METRIC RANK
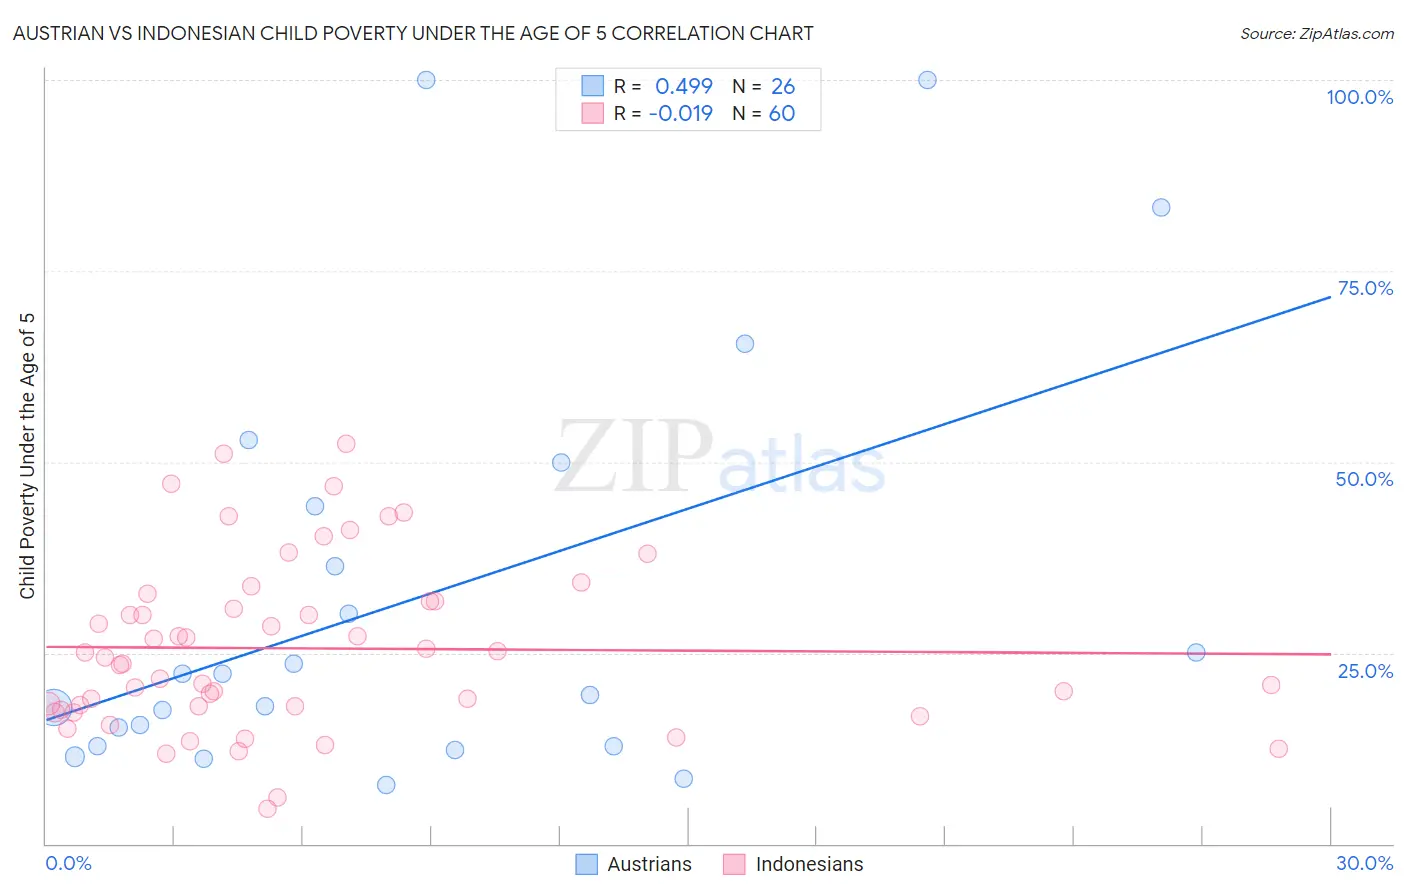
Austrian vs Indonesian Child Poverty Under the Age of 5 Correlation Chart
The statistical analysis conducted on geographies consisting of 426,879,815 people shows a moderate positive correlation between the proportion of Austrians and poverty level among children under the age of 5 in the United States with a correlation coefficient (R) of 0.499 and weighted average of 16.1%. Similarly, the statistical analysis conducted on geographies consisting of 159,867,886 people shows no correlation between the proportion of Indonesians and poverty level among children under the age of 5 in the United States with a correlation coefficient (R) of -0.019 and weighted average of 22.3%, a difference of 37.8%.
Child Poverty Under the Age of 5 Correlation Summary
| Measurement | Austrian | Indonesian |
| Minimum | 7.7% | 4.6% |
| Maximum | 100.0% | 52.3% |
| Range | 92.3% | 47.8% |
| Mean | 32.1% | 25.6% |
| Median | 20.8% | 24.0% |
| Interquartile 25% (IQ1) | 12.8% | 17.8% |
| Interquartile 75% (IQ3) | 44.1% | 31.8% |
| Interquartile Range (IQR) | 31.3% | 14.0% |
| Standard Deviation (Sample) | 27.3% | 11.1% |
| Standard Deviation (Population) | 26.8% | 11.0% |
Similar Demographics by Child Poverty Under the Age of 5
Demographics Similar to Austrians by Child Poverty Under the Age of 5
In terms of child poverty under the age of 5, the demographic groups most similar to Austrians are Swiss (16.1%, a difference of 0.010%), Immigrants from Southern Europe (16.1%, a difference of 0.030%), Native Hawaiian (16.2%, a difference of 0.080%), Immigrants from Albania (16.2%, a difference of 0.080%), and Immigrants from England (16.2%, a difference of 0.17%).
| Demographics | Rating | Rank | Child Poverty Under the Age of 5 |
| Immigrants | Austria | 93.5 /100 | #116 | Exceptional 16.0% |
| Basques | 93.4 /100 | #117 | Exceptional 16.0% |
| Immigrants | Denmark | 93.4 /100 | #118 | Exceptional 16.0% |
| Immigrants | Jordan | 93.2 /100 | #119 | Exceptional 16.1% |
| Immigrants | Peru | 92.6 /100 | #120 | Exceptional 16.1% |
| Mongolians | 92.5 /100 | #121 | Exceptional 16.1% |
| Immigrants | Southern Europe | 92.0 /100 | #122 | Exceptional 16.1% |
| Austrians | 92.0 /100 | #123 | Exceptional 16.1% |
| Swiss | 92.0 /100 | #124 | Exceptional 16.1% |
| Native Hawaiians | 91.8 /100 | #125 | Exceptional 16.2% |
| Immigrants | Albania | 91.8 /100 | #126 | Exceptional 16.2% |
| Immigrants | England | 91.5 /100 | #127 | Exceptional 16.2% |
| South Africans | 90.1 /100 | #128 | Exceptional 16.2% |
| British | 89.4 /100 | #129 | Excellent 16.3% |
| Immigrants | Norway | 89.3 /100 | #130 | Excellent 16.3% |
Demographics Similar to Indonesians by Child Poverty Under the Age of 5
In terms of child poverty under the age of 5, the demographic groups most similar to Indonesians are Immigrants from Mexico (22.2%, a difference of 0.060%), Immigrants from Guatemala (22.0%, a difference of 0.92%), Inupiat (22.0%, a difference of 1.0%), Iroquois (22.0%, a difference of 1.1%), and Immigrants from Central America (22.0%, a difference of 1.3%).
| Demographics | Rating | Rank | Child Poverty Under the Age of 5 |
| Chickasaw | 0.0 /100 | #299 | Tragic 21.8% |
| Alaskan Athabascans | 0.0 /100 | #300 | Tragic 21.8% |
| Immigrants | Central America | 0.0 /100 | #301 | Tragic 22.0% |
| Iroquois | 0.0 /100 | #302 | Tragic 22.0% |
| Inupiat | 0.0 /100 | #303 | Tragic 22.0% |
| Immigrants | Guatemala | 0.0 /100 | #304 | Tragic 22.0% |
| Immigrants | Mexico | 0.0 /100 | #305 | Tragic 22.2% |
| Indonesians | 0.0 /100 | #306 | Tragic 22.3% |
| Immigrants | Bahamas | 0.0 /100 | #307 | Tragic 22.7% |
| Immigrants | Dominica | 0.0 /100 | #308 | Tragic 22.7% |
| Houma | 0.0 /100 | #309 | Tragic 22.7% |
| Africans | 0.0 /100 | #310 | Tragic 22.8% |
| Seminole | 0.0 /100 | #311 | Tragic 22.8% |
| Hondurans | 0.0 /100 | #312 | Tragic 23.0% |
| Bahamians | 0.0 /100 | #313 | Tragic 23.0% |