Central American vs Immigrants from Nepal Male Poverty
COMPARE
Central American
Immigrants from Nepal
Male Poverty
Male Poverty Comparison
Central Americans
Immigrants from Nepal
13.2%
MALE POVERTY
0.1/ 100
METRIC RATING
263rd/ 347
METRIC RANK
11.0%
MALE POVERTY
67.3/ 100
METRIC RATING
152nd/ 347
METRIC RANK
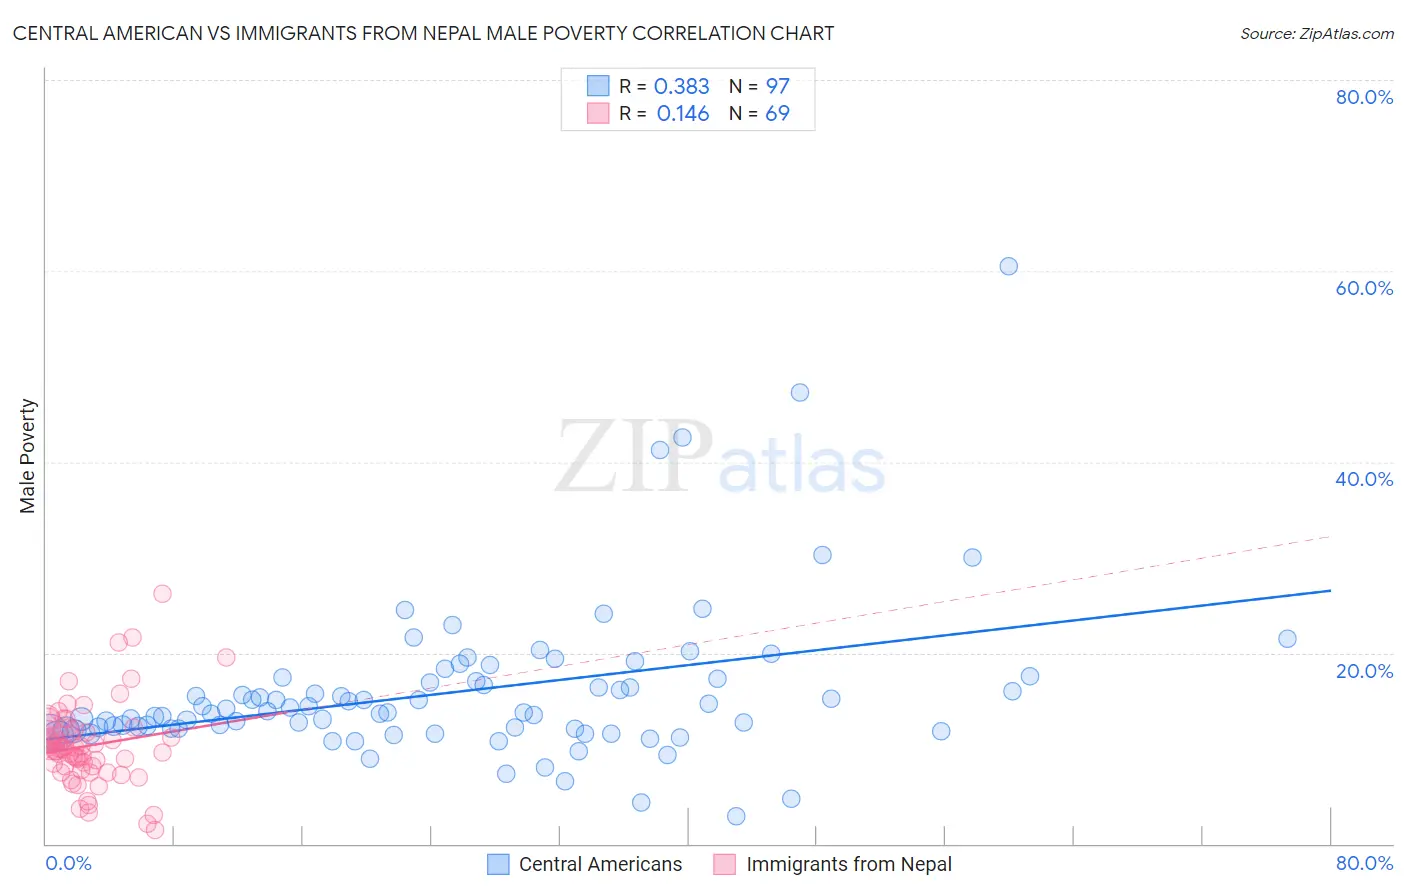
Central American vs Immigrants from Nepal Male Poverty Correlation Chart
The statistical analysis conducted on geographies consisting of 503,856,624 people shows a mild positive correlation between the proportion of Central Americans and poverty level among males in the United States with a correlation coefficient (R) of 0.383 and weighted average of 13.2%. Similarly, the statistical analysis conducted on geographies consisting of 186,636,323 people shows a poor positive correlation between the proportion of Immigrants from Nepal and poverty level among males in the United States with a correlation coefficient (R) of 0.146 and weighted average of 11.0%, a difference of 19.8%.
Male Poverty Correlation Summary
| Measurement | Central American | Immigrants from Nepal |
| Minimum | 2.9% | 1.5% |
| Maximum | 60.5% | 26.3% |
| Range | 57.6% | 24.7% |
| Mean | 15.9% | 10.3% |
| Median | 13.7% | 9.9% |
| Interquartile 25% (IQ1) | 12.0% | 7.9% |
| Interquartile 75% (IQ3) | 17.2% | 11.9% |
| Interquartile Range (IQR) | 5.2% | 4.0% |
| Standard Deviation (Sample) | 8.3% | 4.4% |
| Standard Deviation (Population) | 8.2% | 4.4% |
Similar Demographics by Male Poverty
Demographics Similar to Central Americans by Male Poverty
In terms of male poverty, the demographic groups most similar to Central Americans are Iroquois (13.2%, a difference of 0.36%), Jamaican (13.2%, a difference of 0.38%), Spanish American Indian (13.1%, a difference of 0.40%), Trinidadian and Tobagonian (13.1%, a difference of 0.45%), and Ottawa (13.1%, a difference of 0.47%).
| Demographics | Rating | Rank | Male Poverty |
| Immigrants | Burma/Myanmar | 0.1 /100 | #256 | Tragic 13.0% |
| Immigrants | Trinidad and Tobago | 0.1 /100 | #257 | Tragic 13.1% |
| Cape Verdeans | 0.1 /100 | #258 | Tragic 13.1% |
| Cherokee | 0.1 /100 | #259 | Tragic 13.1% |
| Ottawa | 0.1 /100 | #260 | Tragic 13.1% |
| Trinidadians and Tobagonians | 0.1 /100 | #261 | Tragic 13.1% |
| Spanish American Indians | 0.1 /100 | #262 | Tragic 13.1% |
| Central Americans | 0.1 /100 | #263 | Tragic 13.2% |
| Iroquois | 0.1 /100 | #264 | Tragic 13.2% |
| Jamaicans | 0.1 /100 | #265 | Tragic 13.2% |
| Immigrants | Guyana | 0.1 /100 | #266 | Tragic 13.2% |
| Immigrants | Jamaica | 0.1 /100 | #267 | Tragic 13.3% |
| Sub-Saharan Africans | 0.1 /100 | #268 | Tragic 13.3% |
| Guyanese | 0.0 /100 | #269 | Tragic 13.3% |
| Cree | 0.0 /100 | #270 | Tragic 13.3% |
Demographics Similar to Immigrants from Nepal by Male Poverty
In terms of male poverty, the demographic groups most similar to Immigrants from Nepal are Venezuelan (11.0%, a difference of 0.0%), Guamanian/Chamorro (11.0%, a difference of 0.030%), Immigrants from Venezuela (11.0%, a difference of 0.070%), Armenian (11.0%, a difference of 0.080%), and Icelander (11.0%, a difference of 0.14%).
| Demographics | Rating | Rank | Male Poverty |
| Immigrants | Germany | 71.6 /100 | #145 | Good 10.9% |
| Syrians | 71.4 /100 | #146 | Good 10.9% |
| Icelanders | 68.5 /100 | #147 | Good 11.0% |
| Armenians | 68.0 /100 | #148 | Good 11.0% |
| Immigrants | Venezuela | 67.9 /100 | #149 | Good 11.0% |
| Guamanians/Chamorros | 67.6 /100 | #150 | Good 11.0% |
| Venezuelans | 67.4 /100 | #151 | Good 11.0% |
| Immigrants | Nepal | 67.3 /100 | #152 | Good 11.0% |
| Immigrants | Bosnia and Herzegovina | 65.2 /100 | #153 | Good 11.0% |
| Immigrants | Kazakhstan | 64.8 /100 | #154 | Good 11.0% |
| Immigrants | Malaysia | 64.7 /100 | #155 | Good 11.0% |
| Costa Ricans | 63.9 /100 | #156 | Good 11.0% |
| Scotch-Irish | 63.7 /100 | #157 | Good 11.0% |
| Colombians | 63.0 /100 | #158 | Good 11.0% |
| Taiwanese | 62.7 /100 | #159 | Good 11.0% |