Sudanese vs Dominican Child Poverty Under the Age of 5
COMPARE
Sudanese
Dominican
Child Poverty Under the Age of 5
Child Poverty Under the Age of 5 Comparison
Sudanese
Dominicans
19.3%
CHILD POVERTY UNDER THE AGE OF 5
0.9/ 100
METRIC RATING
233rd/ 347
METRIC RANK
24.0%
CHILD POVERTY UNDER THE AGE OF 5
0.0/ 100
METRIC RATING
327th/ 347
METRIC RANK
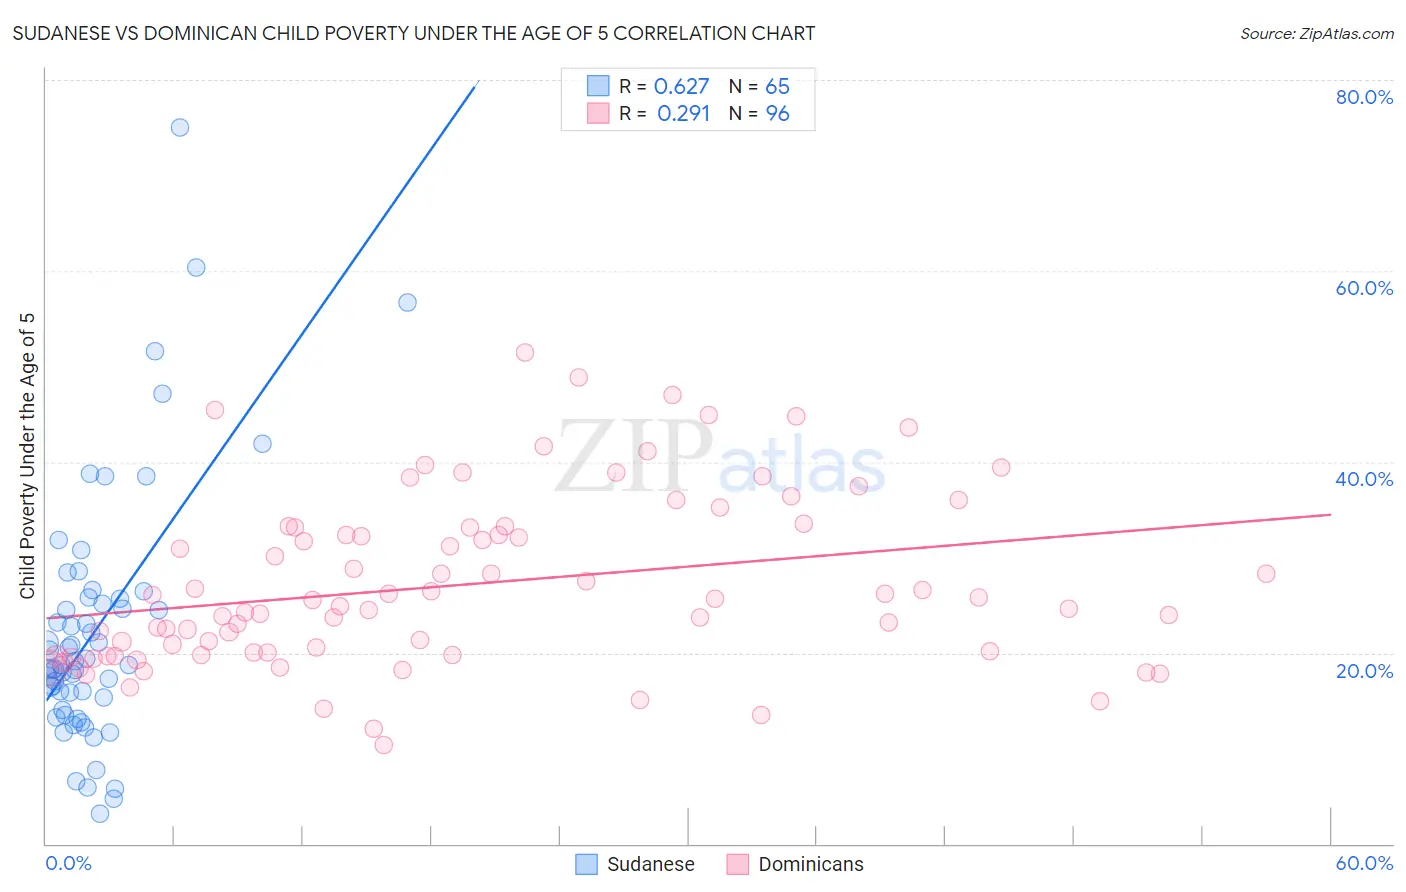
Sudanese vs Dominican Child Poverty Under the Age of 5 Correlation Chart
The statistical analysis conducted on geographies consisting of 109,330,527 people shows a significant positive correlation between the proportion of Sudanese and poverty level among children under the age of 5 in the United States with a correlation coefficient (R) of 0.627 and weighted average of 19.3%. Similarly, the statistical analysis conducted on geographies consisting of 342,515,454 people shows a weak positive correlation between the proportion of Dominicans and poverty level among children under the age of 5 in the United States with a correlation coefficient (R) of 0.291 and weighted average of 24.0%, a difference of 24.3%.
Child Poverty Under the Age of 5 Correlation Summary
| Measurement | Sudanese | Dominican |
| Minimum | 3.1% | 10.3% |
| Maximum | 75.0% | 51.4% |
| Range | 71.9% | 41.1% |
| Mean | 22.4% | 27.2% |
| Median | 18.8% | 25.2% |
| Interquartile 25% (IQ1) | 14.6% | 19.9% |
| Interquartile 75% (IQ3) | 25.7% | 33.1% |
| Interquartile Range (IQR) | 11.1% | 13.2% |
| Standard Deviation (Sample) | 13.4% | 9.0% |
| Standard Deviation (Population) | 13.3% | 9.0% |
Similar Demographics by Child Poverty Under the Age of 5
Demographics Similar to Sudanese by Child Poverty Under the Age of 5
In terms of child poverty under the age of 5, the demographic groups most similar to Sudanese are Trinidadian and Tobagonian (19.3%, a difference of 0.060%), Immigrants from Micronesia (19.4%, a difference of 0.12%), Immigrants from Laos (19.4%, a difference of 0.33%), Immigrants from Trinidad and Tobago (19.4%, a difference of 0.34%), and Bermudan (19.2%, a difference of 0.62%).
| Demographics | Rating | Rank | Child Poverty Under the Age of 5 |
| Immigrants | Eritrea | 1.5 /100 | #226 | Tragic 19.1% |
| Cape Verdeans | 1.4 /100 | #227 | Tragic 19.1% |
| Immigrants | Sudan | 1.3 /100 | #228 | Tragic 19.2% |
| Ghanaians | 1.2 /100 | #229 | Tragic 19.2% |
| Ecuadorians | 1.2 /100 | #230 | Tragic 19.2% |
| Bermudans | 1.2 /100 | #231 | Tragic 19.2% |
| Trinidadians and Tobagonians | 0.9 /100 | #232 | Tragic 19.3% |
| Sudanese | 0.9 /100 | #233 | Tragic 19.3% |
| Immigrants | Micronesia | 0.9 /100 | #234 | Tragic 19.4% |
| Immigrants | Laos | 0.8 /100 | #235 | Tragic 19.4% |
| Immigrants | Trinidad and Tobago | 0.8 /100 | #236 | Tragic 19.4% |
| Immigrants | Cabo Verde | 0.6 /100 | #237 | Tragic 19.5% |
| Salvadorans | 0.6 /100 | #238 | Tragic 19.5% |
| Vietnamese | 0.6 /100 | #239 | Tragic 19.5% |
| Immigrants | Ecuador | 0.5 /100 | #240 | Tragic 19.6% |
Demographics Similar to Dominicans by Child Poverty Under the Age of 5
In terms of child poverty under the age of 5, the demographic groups most similar to Dominicans are Immigrants from Dominican Republic (24.1%, a difference of 0.090%), Cajun (24.1%, a difference of 0.32%), Central American Indian (23.9%, a difference of 0.45%), Immigrants from Congo (23.9%, a difference of 0.64%), and Creek (24.2%, a difference of 0.76%).
| Demographics | Rating | Rank | Child Poverty Under the Age of 5 |
| Choctaw | 0.0 /100 | #320 | Tragic 23.5% |
| Immigrants | Honduras | 0.0 /100 | #321 | Tragic 23.5% |
| Ute | 0.0 /100 | #322 | Tragic 23.5% |
| Pueblo | 0.0 /100 | #323 | Tragic 23.7% |
| Paiute | 0.0 /100 | #324 | Tragic 23.8% |
| Immigrants | Congo | 0.0 /100 | #325 | Tragic 23.9% |
| Central American Indians | 0.0 /100 | #326 | Tragic 23.9% |
| Dominicans | 0.0 /100 | #327 | Tragic 24.0% |
| Immigrants | Dominican Republic | 0.0 /100 | #328 | Tragic 24.1% |
| Cajuns | 0.0 /100 | #329 | Tragic 24.1% |
| Creek | 0.0 /100 | #330 | Tragic 24.2% |
| Kiowa | 0.0 /100 | #331 | Tragic 24.5% |
| Apache | 0.0 /100 | #332 | Tragic 25.0% |
| Natives/Alaskans | 0.0 /100 | #333 | Tragic 25.6% |
| Blacks/African Americans | 0.0 /100 | #334 | Tragic 25.7% |