Immigrants from Zimbabwe vs Dominican Child Poverty Under the Age of 5
COMPARE
Immigrants from Zimbabwe
Dominican
Child Poverty Under the Age of 5
Child Poverty Under the Age of 5 Comparison
Immigrants from Zimbabwe
Dominicans
15.8%
CHILD POVERTY UNDER THE AGE OF 5
95.9/ 100
METRIC RATING
101st/ 347
METRIC RANK
24.0%
CHILD POVERTY UNDER THE AGE OF 5
0.0/ 100
METRIC RATING
327th/ 347
METRIC RANK
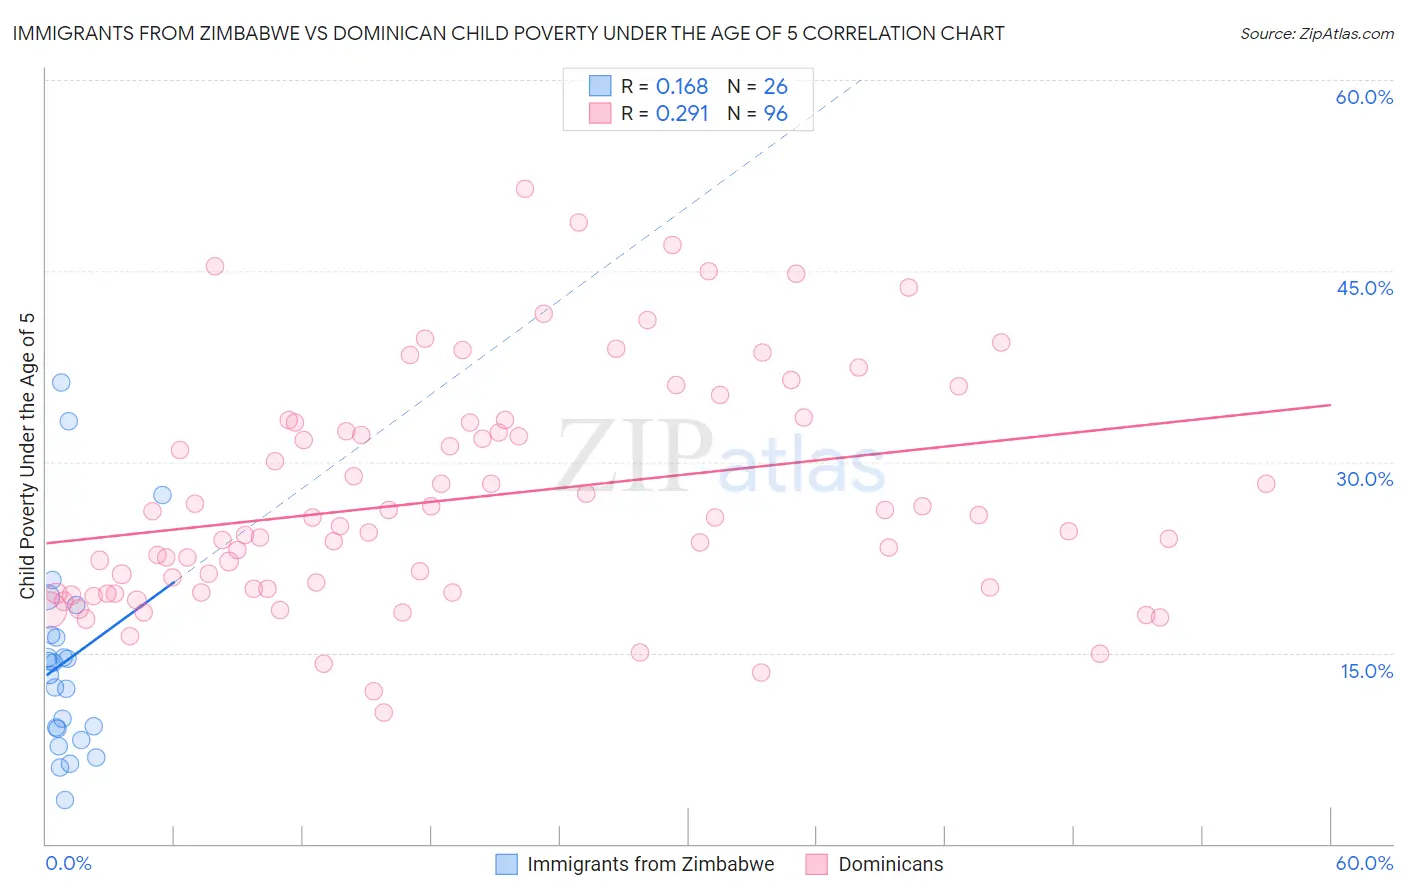
Immigrants from Zimbabwe vs Dominican Child Poverty Under the Age of 5 Correlation Chart
The statistical analysis conducted on geographies consisting of 116,092,929 people shows a poor positive correlation between the proportion of Immigrants from Zimbabwe and poverty level among children under the age of 5 in the United States with a correlation coefficient (R) of 0.168 and weighted average of 15.8%. Similarly, the statistical analysis conducted on geographies consisting of 342,515,454 people shows a weak positive correlation between the proportion of Dominicans and poverty level among children under the age of 5 in the United States with a correlation coefficient (R) of 0.291 and weighted average of 24.0%, a difference of 51.9%.
Child Poverty Under the Age of 5 Correlation Summary
| Measurement | Immigrants from Zimbabwe | Dominican |
| Minimum | 3.4% | 10.3% |
| Maximum | 36.2% | 51.4% |
| Range | 32.8% | 41.1% |
| Mean | 14.4% | 27.2% |
| Median | 13.8% | 25.2% |
| Interquartile 25% (IQ1) | 9.1% | 19.9% |
| Interquartile 75% (IQ3) | 16.4% | 33.1% |
| Interquartile Range (IQR) | 7.4% | 13.2% |
| Standard Deviation (Sample) | 8.0% | 9.0% |
| Standard Deviation (Population) | 7.9% | 9.0% |
Similar Demographics by Child Poverty Under the Age of 5
Demographics Similar to Immigrants from Zimbabwe by Child Poverty Under the Age of 5
In terms of child poverty under the age of 5, the demographic groups most similar to Immigrants from Zimbabwe are Immigrants from Canada (15.8%, a difference of 0.010%), Palestinian (15.8%, a difference of 0.020%), Immigrants from South Africa (15.8%, a difference of 0.13%), Armenian (15.8%, a difference of 0.13%), and Macedonian (15.8%, a difference of 0.20%).
| Demographics | Rating | Rank | Child Poverty Under the Age of 5 |
| Immigrants | South Eastern Asia | 97.1 /100 | #94 | Exceptional 15.7% |
| Immigrants | Switzerland | 96.4 /100 | #95 | Exceptional 15.8% |
| Immigrants | Kazakhstan | 96.2 /100 | #96 | Exceptional 15.8% |
| Macedonians | 96.2 /100 | #97 | Exceptional 15.8% |
| Immigrants | South Africa | 96.1 /100 | #98 | Exceptional 15.8% |
| Palestinians | 95.9 /100 | #99 | Exceptional 15.8% |
| Immigrants | Canada | 95.9 /100 | #100 | Exceptional 15.8% |
| Immigrants | Zimbabwe | 95.9 /100 | #101 | Exceptional 15.8% |
| Armenians | 95.7 /100 | #102 | Exceptional 15.8% |
| Europeans | 95.3 /100 | #103 | Exceptional 15.9% |
| Immigrants | North America | 94.9 /100 | #104 | Exceptional 15.9% |
| Immigrants | Spain | 94.8 /100 | #105 | Exceptional 15.9% |
| Tlingit-Haida | 94.7 /100 | #106 | Exceptional 15.9% |
| Slovenes | 94.4 /100 | #107 | Exceptional 16.0% |
| Immigrants | Brazil | 94.4 /100 | #108 | Exceptional 16.0% |
Demographics Similar to Dominicans by Child Poverty Under the Age of 5
In terms of child poverty under the age of 5, the demographic groups most similar to Dominicans are Immigrants from Dominican Republic (24.1%, a difference of 0.090%), Cajun (24.1%, a difference of 0.32%), Central American Indian (23.9%, a difference of 0.45%), Immigrants from Congo (23.9%, a difference of 0.64%), and Creek (24.2%, a difference of 0.76%).
| Demographics | Rating | Rank | Child Poverty Under the Age of 5 |
| Choctaw | 0.0 /100 | #320 | Tragic 23.5% |
| Immigrants | Honduras | 0.0 /100 | #321 | Tragic 23.5% |
| Ute | 0.0 /100 | #322 | Tragic 23.5% |
| Pueblo | 0.0 /100 | #323 | Tragic 23.7% |
| Paiute | 0.0 /100 | #324 | Tragic 23.8% |
| Immigrants | Congo | 0.0 /100 | #325 | Tragic 23.9% |
| Central American Indians | 0.0 /100 | #326 | Tragic 23.9% |
| Dominicans | 0.0 /100 | #327 | Tragic 24.0% |
| Immigrants | Dominican Republic | 0.0 /100 | #328 | Tragic 24.1% |
| Cajuns | 0.0 /100 | #329 | Tragic 24.1% |
| Creek | 0.0 /100 | #330 | Tragic 24.2% |
| Kiowa | 0.0 /100 | #331 | Tragic 24.5% |
| Apache | 0.0 /100 | #332 | Tragic 25.0% |
| Natives/Alaskans | 0.0 /100 | #333 | Tragic 25.6% |
| Blacks/African Americans | 0.0 /100 | #334 | Tragic 25.7% |