Croatian vs Pakistani Single Female Poverty
COMPARE
Croatian
Pakistani
Single Female Poverty
Single Female Poverty Comparison
Croatians
Pakistanis
19.7%
SINGLE FEMALE POVERTY
98.1/ 100
METRIC RATING
97th/ 347
METRIC RANK
20.2%
SINGLE FEMALE POVERTY
92.1/ 100
METRIC RATING
131st/ 347
METRIC RANK
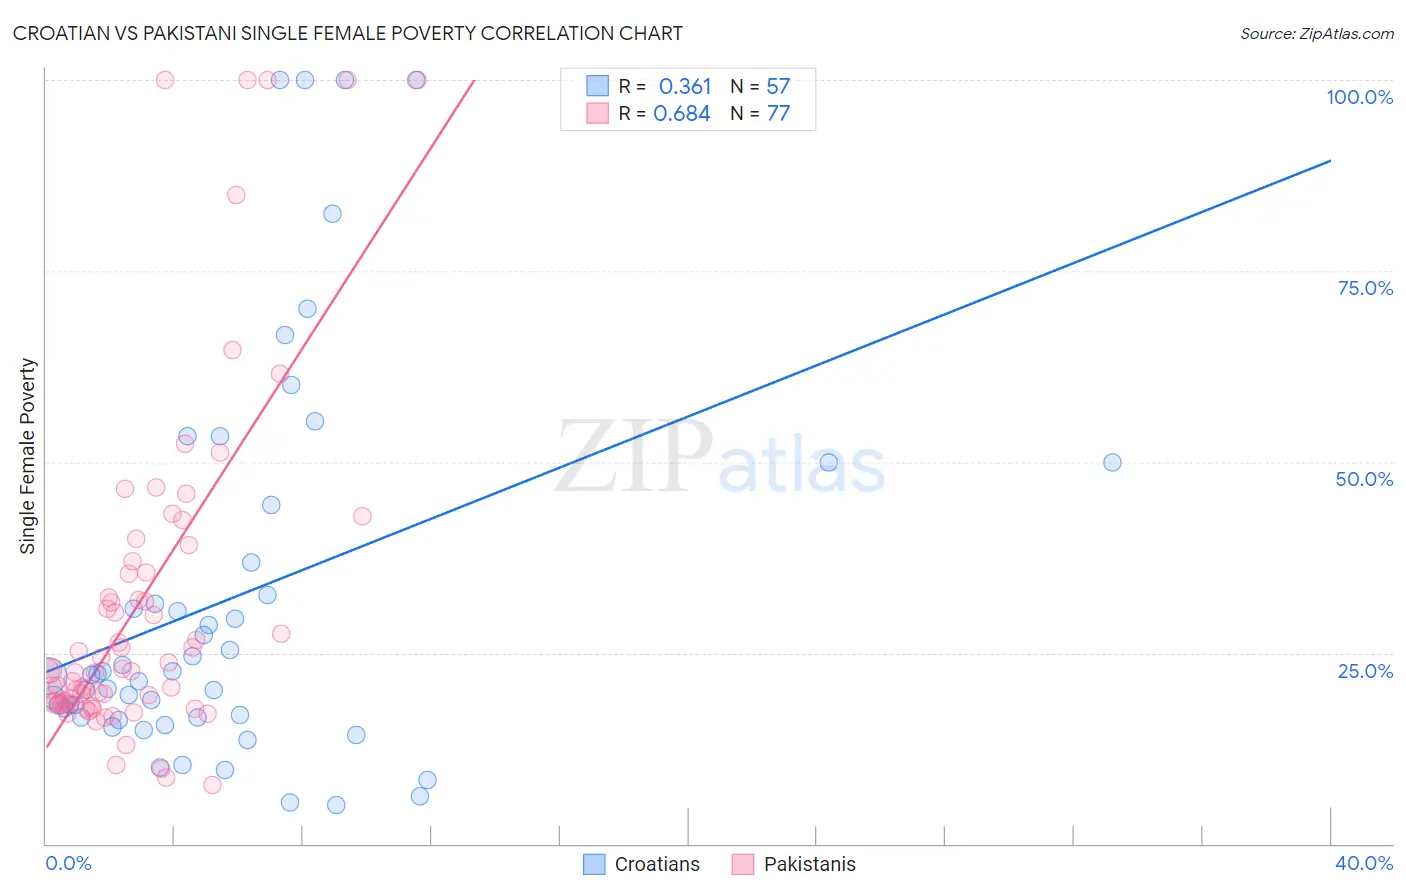
Croatian vs Pakistani Single Female Poverty Correlation Chart
The statistical analysis conducted on geographies consisting of 368,567,193 people shows a mild positive correlation between the proportion of Croatians and poverty level among single females in the United States with a correlation coefficient (R) of 0.361 and weighted average of 19.7%. Similarly, the statistical analysis conducted on geographies consisting of 331,803,446 people shows a significant positive correlation between the proportion of Pakistanis and poverty level among single females in the United States with a correlation coefficient (R) of 0.684 and weighted average of 20.2%, a difference of 2.5%.
Single Female Poverty Correlation Summary
| Measurement | Croatian | Pakistani |
| Minimum | 5.0% | 7.7% |
| Maximum | 100.0% | 100.0% |
| Range | 95.0% | 92.3% |
| Mean | 32.0% | 31.6% |
| Median | 22.1% | 22.6% |
| Interquartile 25% (IQ1) | 16.5% | 18.4% |
| Interquartile 75% (IQ3) | 40.6% | 36.2% |
| Interquartile Range (IQR) | 24.0% | 17.8% |
| Standard Deviation (Sample) | 25.3% | 22.5% |
| Standard Deviation (Population) | 25.1% | 22.4% |
Similar Demographics by Single Female Poverty
Demographics Similar to Croatians by Single Female Poverty
In terms of single female poverty, the demographic groups most similar to Croatians are Immigrants from Brazil (19.7%, a difference of 0.090%), Immigrants from France (19.7%, a difference of 0.13%), Estonian (19.7%, a difference of 0.14%), Sierra Leonean (19.7%, a difference of 0.14%), and Ukrainian (19.8%, a difference of 0.39%).
| Demographics | Rating | Rank | Single Female Poverty |
| Immigrants | Lebanon | 98.8 /100 | #90 | Exceptional 19.6% |
| Soviet Union | 98.8 /100 | #91 | Exceptional 19.6% |
| Italians | 98.8 /100 | #92 | Exceptional 19.6% |
| Immigrants | Austria | 98.8 /100 | #93 | Exceptional 19.6% |
| Romanians | 98.6 /100 | #94 | Exceptional 19.6% |
| Estonians | 98.2 /100 | #95 | Exceptional 19.7% |
| Immigrants | Brazil | 98.2 /100 | #96 | Exceptional 19.7% |
| Croatians | 98.1 /100 | #97 | Exceptional 19.7% |
| Immigrants | France | 97.9 /100 | #98 | Exceptional 19.7% |
| Sierra Leoneans | 97.9 /100 | #99 | Exceptional 19.7% |
| Ukrainians | 97.6 /100 | #100 | Exceptional 19.8% |
| Immigrants | Belgium | 97.3 /100 | #101 | Exceptional 19.8% |
| Immigrants | Cameroon | 97.3 /100 | #102 | Exceptional 19.8% |
| Immigrants | Southern Europe | 97.1 /100 | #103 | Exceptional 19.9% |
| Chileans | 96.9 /100 | #104 | Exceptional 19.9% |
Demographics Similar to Pakistanis by Single Female Poverty
In terms of single female poverty, the demographic groups most similar to Pakistanis are Uruguayan (20.2%, a difference of 0.0%), Immigrants from England (20.2%, a difference of 0.030%), Immigrants from Hungary (20.2%, a difference of 0.050%), Immigrants from Morocco (20.2%, a difference of 0.080%), and Immigrants from Venezuela (20.2%, a difference of 0.12%).
| Demographics | Rating | Rank | Single Female Poverty |
| Immigrants | Chile | 94.3 /100 | #124 | Exceptional 20.1% |
| Immigrants | South Africa | 93.9 /100 | #125 | Exceptional 20.1% |
| Serbians | 93.3 /100 | #126 | Exceptional 20.1% |
| Mongolians | 93.2 /100 | #127 | Exceptional 20.2% |
| Immigrants | Spain | 92.7 /100 | #128 | Exceptional 20.2% |
| Immigrants | Morocco | 92.4 /100 | #129 | Exceptional 20.2% |
| Immigrants | Hungary | 92.3 /100 | #130 | Exceptional 20.2% |
| Pakistanis | 92.1 /100 | #131 | Exceptional 20.2% |
| Uruguayans | 92.1 /100 | #132 | Exceptional 20.2% |
| Immigrants | England | 91.9 /100 | #133 | Exceptional 20.2% |
| Immigrants | Venezuela | 91.5 /100 | #134 | Exceptional 20.2% |
| Immigrants | Iraq | 91.2 /100 | #135 | Exceptional 20.2% |
| Immigrants | Canada | 91.2 /100 | #136 | Exceptional 20.2% |
| Immigrants | Nepal | 90.6 /100 | #137 | Exceptional 20.3% |
| Slovenes | 90.5 /100 | #138 | Exceptional 20.3% |