American vs Sioux Child Poverty Under the Age of 5
COMPARE
American
Sioux
Child Poverty Under the Age of 5
Child Poverty Under the Age of 5 Comparison
Americans
Sioux
20.5%
CHILD POVERTY UNDER THE AGE OF 5
0.1/ 100
METRIC RATING
271st/ 347
METRIC RANK
26.9%
CHILD POVERTY UNDER THE AGE OF 5
0.0/ 100
METRIC RATING
336th/ 347
METRIC RANK
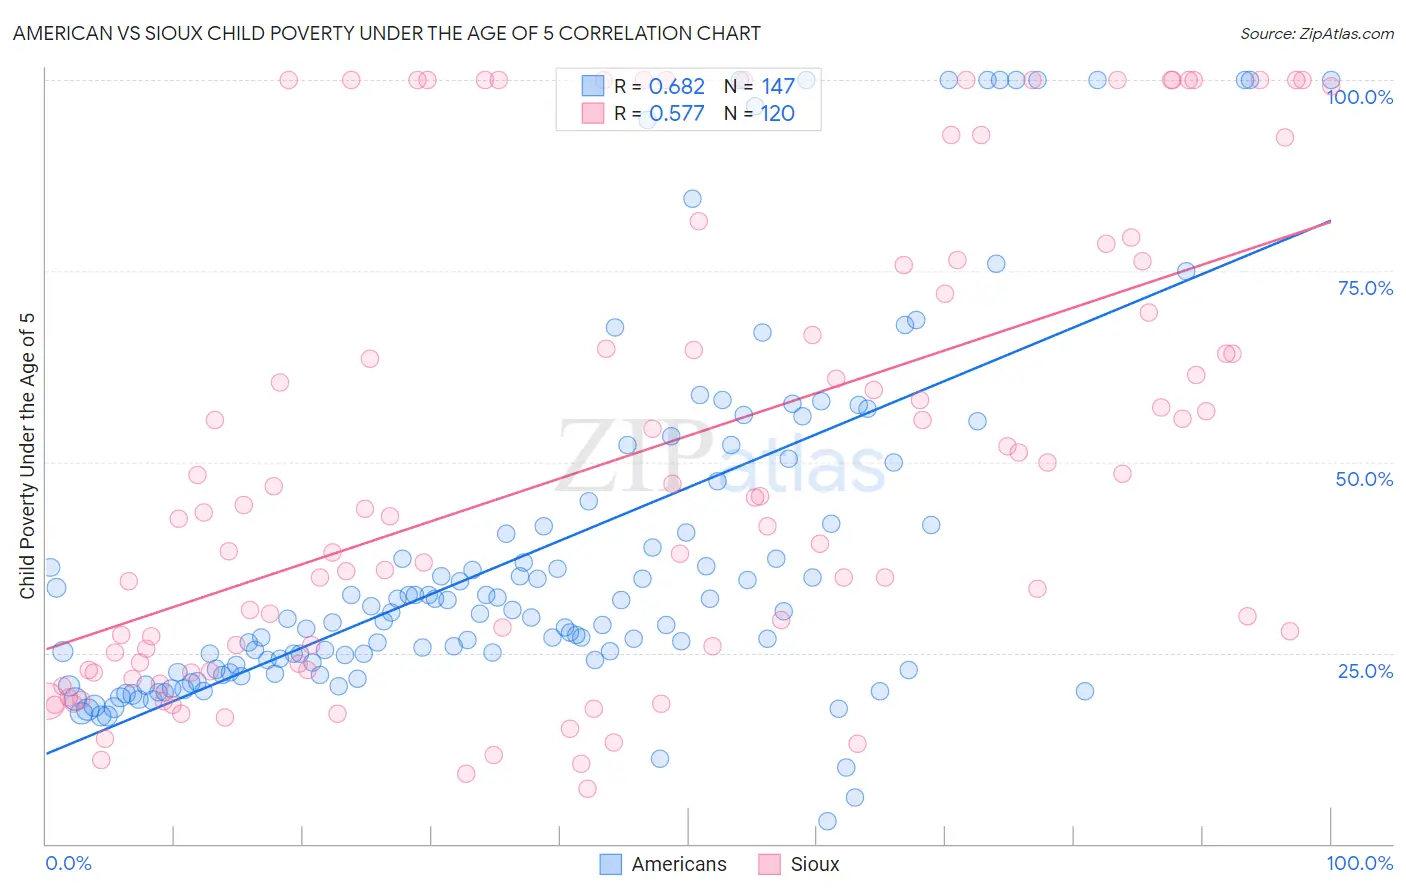
American vs Sioux Child Poverty Under the Age of 5 Correlation Chart
The statistical analysis conducted on geographies consisting of 538,793,741 people shows a significant positive correlation between the proportion of Americans and poverty level among children under the age of 5 in the United States with a correlation coefficient (R) of 0.682 and weighted average of 20.5%. Similarly, the statistical analysis conducted on geographies consisting of 228,915,867 people shows a substantial positive correlation between the proportion of Sioux and poverty level among children under the age of 5 in the United States with a correlation coefficient (R) of 0.577 and weighted average of 26.9%, a difference of 31.6%.
Child Poverty Under the Age of 5 Correlation Summary
| Measurement | American | Sioux |
| Minimum | 2.9% | 7.1% |
| Maximum | 100.0% | 100.0% |
| Range | 97.1% | 92.9% |
| Mean | 38.1% | 50.3% |
| Median | 29.6% | 43.6% |
| Interquartile 25% (IQ1) | 22.8% | 23.7% |
| Interquartile 75% (IQ3) | 41.9% | 73.9% |
| Interquartile Range (IQR) | 19.1% | 50.3% |
| Standard Deviation (Sample) | 23.8% | 30.1% |
| Standard Deviation (Population) | 23.7% | 30.0% |
Similar Demographics by Child Poverty Under the Age of 5
Demographics Similar to Americans by Child Poverty Under the Age of 5
In terms of child poverty under the age of 5, the demographic groups most similar to Americans are Immigrants from Jamaica (20.5%, a difference of 0.12%), Jamaican (20.4%, a difference of 0.45%), Immigrants from Burma/Myanmar (20.4%, a difference of 0.52%), Ottawa (20.3%, a difference of 0.61%), and Belizean (20.3%, a difference of 0.61%).
| Demographics | Rating | Rank | Child Poverty Under the Age of 5 |
| Immigrants | Liberia | 0.1 /100 | #264 | Tragic 20.2% |
| Spanish American Indians | 0.1 /100 | #265 | Tragic 20.2% |
| Aleuts | 0.1 /100 | #266 | Tragic 20.3% |
| Ottawa | 0.1 /100 | #267 | Tragic 20.3% |
| Belizeans | 0.1 /100 | #268 | Tragic 20.3% |
| Immigrants | Burma/Myanmar | 0.1 /100 | #269 | Tragic 20.4% |
| Jamaicans | 0.1 /100 | #270 | Tragic 20.4% |
| Americans | 0.1 /100 | #271 | Tragic 20.5% |
| Immigrants | Jamaica | 0.1 /100 | #272 | Tragic 20.5% |
| Central Americans | 0.1 /100 | #273 | Tragic 20.6% |
| Immigrants | Belize | 0.1 /100 | #274 | Tragic 20.6% |
| Bangladeshis | 0.1 /100 | #275 | Tragic 20.6% |
| West Indians | 0.0 /100 | #276 | Tragic 20.6% |
| Immigrants | West Indies | 0.0 /100 | #277 | Tragic 20.7% |
| Immigrants | Grenada | 0.0 /100 | #278 | Tragic 20.7% |
Demographics Similar to Sioux by Child Poverty Under the Age of 5
In terms of child poverty under the age of 5, the demographic groups most similar to Sioux are Pima (27.4%, a difference of 1.9%), Hopi (27.7%, a difference of 2.9%), Yup'ik (27.7%, a difference of 3.0%), Black/African American (25.7%, a difference of 4.9%), and Colville (25.7%, a difference of 4.9%).
| Demographics | Rating | Rank | Child Poverty Under the Age of 5 |
| Cajuns | 0.0 /100 | #329 | Tragic 24.1% |
| Creek | 0.0 /100 | #330 | Tragic 24.2% |
| Kiowa | 0.0 /100 | #331 | Tragic 24.5% |
| Apache | 0.0 /100 | #332 | Tragic 25.0% |
| Natives/Alaskans | 0.0 /100 | #333 | Tragic 25.6% |
| Blacks/African Americans | 0.0 /100 | #334 | Tragic 25.7% |
| Colville | 0.0 /100 | #335 | Tragic 25.7% |
| Sioux | 0.0 /100 | #336 | Tragic 26.9% |
| Pima | 0.0 /100 | #337 | Tragic 27.4% |
| Hopi | 0.0 /100 | #338 | Tragic 27.7% |
| Yup'ik | 0.0 /100 | #339 | Tragic 27.7% |
| Cheyenne | 0.0 /100 | #340 | Tragic 28.3% |
| Immigrants | Yemen | 0.0 /100 | #341 | Tragic 29.3% |
| Tohono O'odham | 0.0 /100 | #342 | Tragic 29.5% |
| Yuman | 0.0 /100 | #343 | Tragic 29.5% |