Alsatian vs Immigrants from Bahamas Male Poverty
COMPARE
Alsatian
Immigrants from Bahamas
Male Poverty
Male Poverty Comparison
Alsatians
Immigrants from Bahamas
12.4%
MALE POVERTY
1.3/ 100
METRIC RATING
228th/ 347
METRIC RANK
13.5%
MALE POVERTY
0.0/ 100
METRIC RATING
272nd/ 347
METRIC RANK
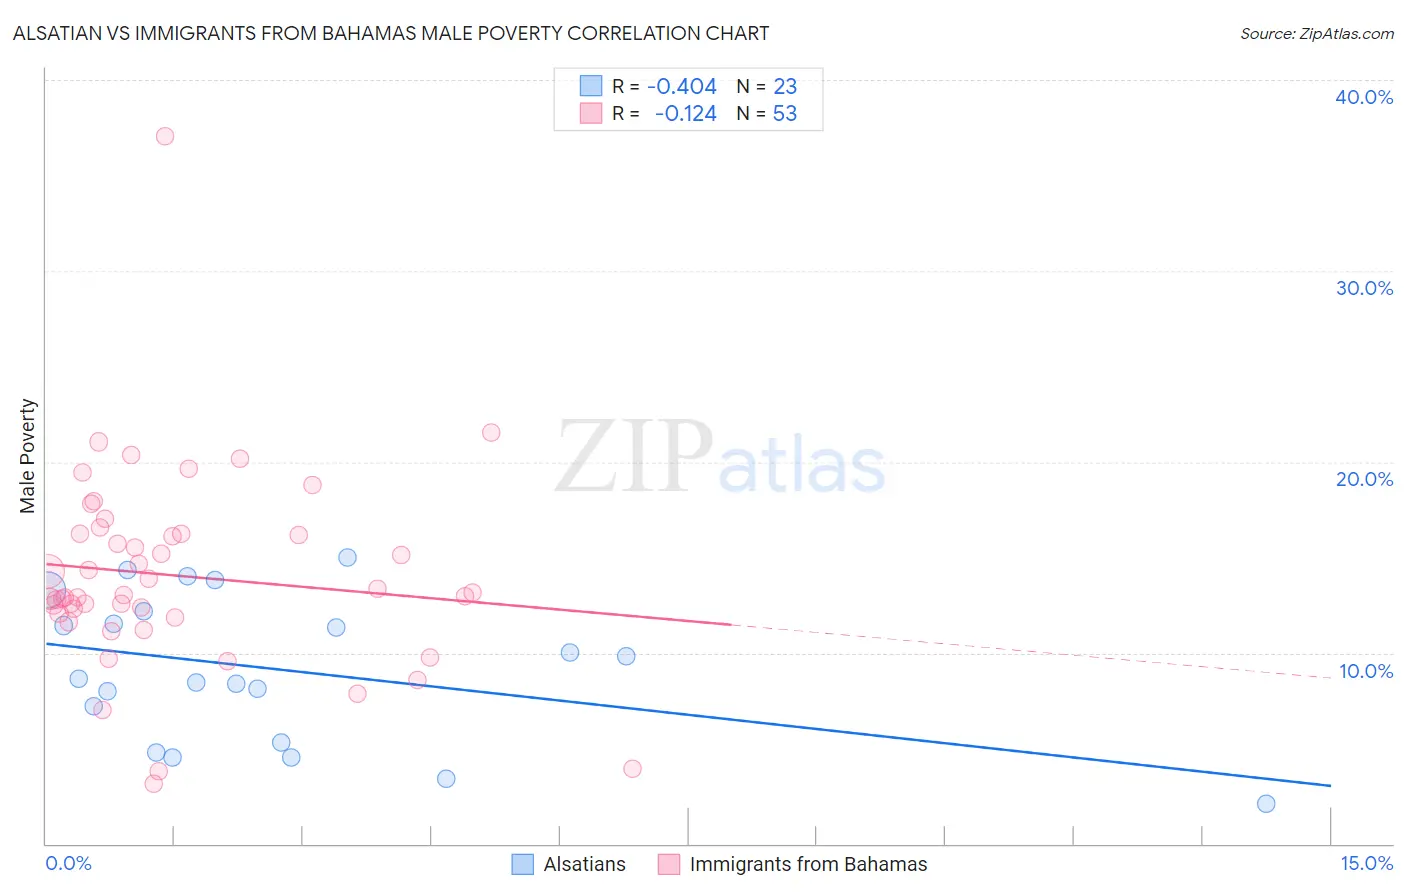
Alsatian vs Immigrants from Bahamas Male Poverty Correlation Chart
The statistical analysis conducted on geographies consisting of 82,673,926 people shows a moderate negative correlation between the proportion of Alsatians and poverty level among males in the United States with a correlation coefficient (R) of -0.404 and weighted average of 12.4%. Similarly, the statistical analysis conducted on geographies consisting of 104,609,154 people shows a poor negative correlation between the proportion of Immigrants from Bahamas and poverty level among males in the United States with a correlation coefficient (R) of -0.124 and weighted average of 13.5%, a difference of 8.8%.
Male Poverty Correlation Summary
| Measurement | Alsatian | Immigrants from Bahamas |
| Minimum | 2.1% | 3.1% |
| Maximum | 15.0% | 37.0% |
| Range | 12.9% | 33.9% |
| Mean | 9.1% | 14.0% |
| Median | 8.6% | 13.0% |
| Interquartile 25% (IQ1) | 5.3% | 11.9% |
| Interquartile 75% (IQ3) | 12.2% | 16.2% |
| Interquartile Range (IQR) | 6.9% | 4.3% |
| Standard Deviation (Sample) | 3.8% | 5.2% |
| Standard Deviation (Population) | 3.7% | 5.2% |
Similar Demographics by Male Poverty
Demographics Similar to Alsatians by Male Poverty
In terms of male poverty, the demographic groups most similar to Alsatians are Alaska Native (12.4%, a difference of 0.040%), Cuban (12.4%, a difference of 0.090%), Nigerian (12.3%, a difference of 0.13%), Osage (12.3%, a difference of 0.30%), and Immigrants from Nigeria (12.3%, a difference of 0.36%).
| Demographics | Rating | Rank | Male Poverty |
| Ugandans | 2.2 /100 | #221 | Tragic 12.2% |
| Immigrants | Africa | 2.1 /100 | #222 | Tragic 12.2% |
| Immigrants | Micronesia | 2.1 /100 | #223 | Tragic 12.2% |
| Immigrants | Nigeria | 1.6 /100 | #224 | Tragic 12.3% |
| Osage | 1.5 /100 | #225 | Tragic 12.3% |
| Nigerians | 1.4 /100 | #226 | Tragic 12.3% |
| Alaska Natives | 1.4 /100 | #227 | Tragic 12.4% |
| Alsatians | 1.3 /100 | #228 | Tragic 12.4% |
| Cubans | 1.3 /100 | #229 | Tragic 12.4% |
| Marshallese | 0.8 /100 | #230 | Tragic 12.5% |
| Salvadorans | 0.6 /100 | #231 | Tragic 12.6% |
| Nicaraguans | 0.6 /100 | #232 | Tragic 12.6% |
| Fijians | 0.6 /100 | #233 | Tragic 12.6% |
| Immigrants | Armenia | 0.6 /100 | #234 | Tragic 12.6% |
| Immigrants | Laos | 0.5 /100 | #235 | Tragic 12.6% |
Demographics Similar to Immigrants from Bahamas by Male Poverty
In terms of male poverty, the demographic groups most similar to Immigrants from Bahamas are Chickasaw (13.5%, a difference of 0.29%), Immigrants from West Indies (13.5%, a difference of 0.37%), Spanish American (13.4%, a difference of 0.75%), Cree (13.3%, a difference of 0.78%), and Barbadian (13.6%, a difference of 0.99%).
| Demographics | Rating | Rank | Male Poverty |
| Jamaicans | 0.1 /100 | #265 | Tragic 13.2% |
| Immigrants | Guyana | 0.1 /100 | #266 | Tragic 13.2% |
| Immigrants | Jamaica | 0.1 /100 | #267 | Tragic 13.3% |
| Sub-Saharan Africans | 0.1 /100 | #268 | Tragic 13.3% |
| Guyanese | 0.0 /100 | #269 | Tragic 13.3% |
| Cree | 0.0 /100 | #270 | Tragic 13.3% |
| Spanish Americans | 0.0 /100 | #271 | Tragic 13.4% |
| Immigrants | Bahamas | 0.0 /100 | #272 | Tragic 13.5% |
| Chickasaw | 0.0 /100 | #273 | Tragic 13.5% |
| Immigrants | West Indies | 0.0 /100 | #274 | Tragic 13.5% |
| Barbadians | 0.0 /100 | #275 | Tragic 13.6% |
| Immigrants | Latin America | 0.0 /100 | #276 | Tragic 13.6% |
| Bangladeshis | 0.0 /100 | #277 | Tragic 13.6% |
| Belizeans | 0.0 /100 | #278 | Tragic 13.6% |
| Haitians | 0.0 /100 | #279 | Tragic 13.7% |