Alsatian vs Immigrants from Sweden Vision Disability
COMPARE
Alsatian
Immigrants from Sweden
Vision Disability
Vision Disability Comparison
Alsatians
Immigrants from Sweden
2.3%
VISION DISABILITY
0.6/ 100
METRIC RATING
245th/ 347
METRIC RANK
2.0%
VISION DISABILITY
99.7/ 100
METRIC RATING
46th/ 347
METRIC RANK
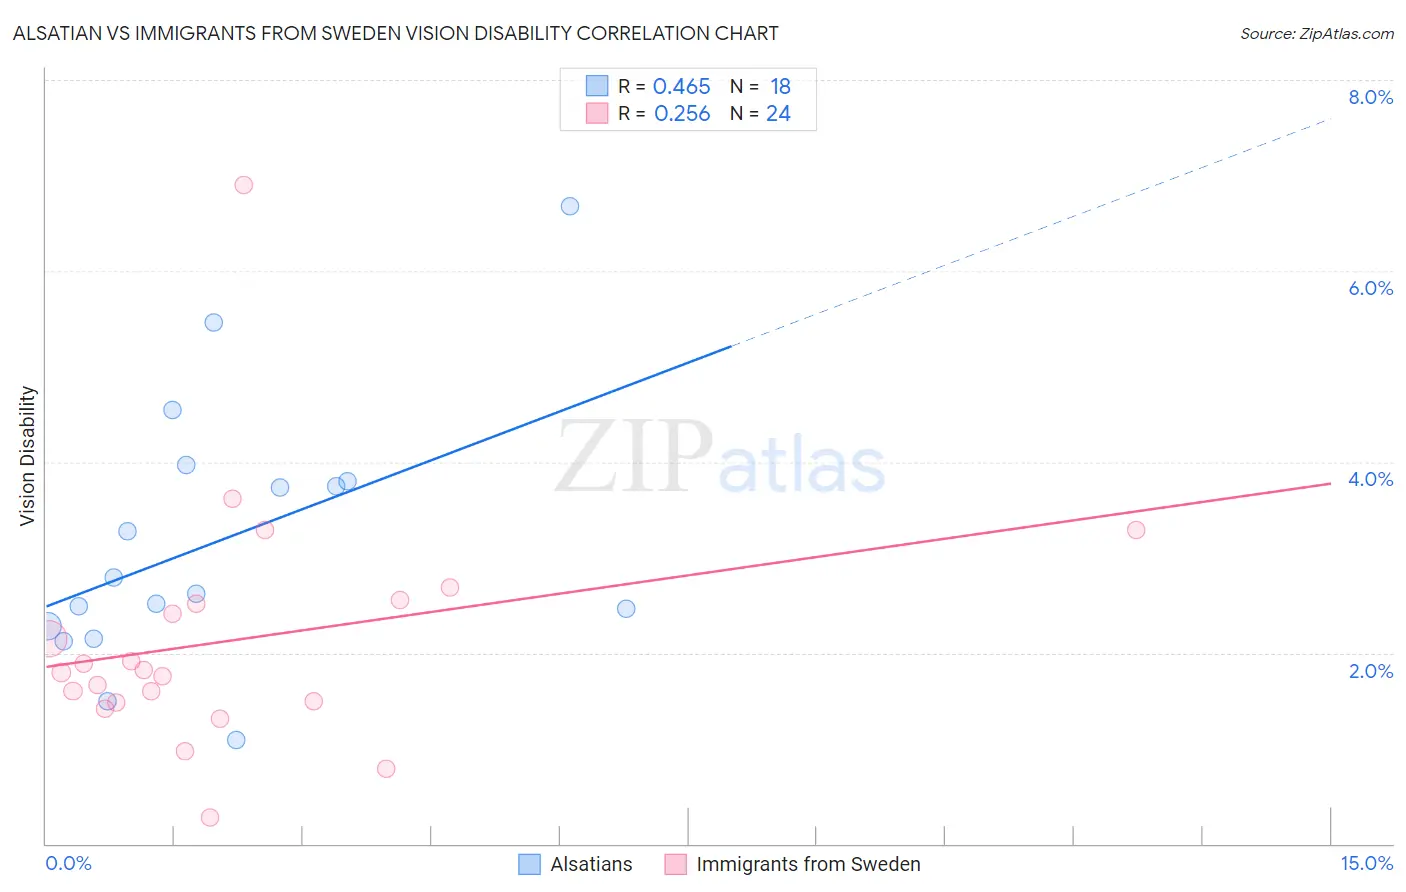
Alsatian vs Immigrants from Sweden Vision Disability Correlation Chart
The statistical analysis conducted on geographies consisting of 82,677,708 people shows a moderate positive correlation between the proportion of Alsatians and percentage of population with vision disability in the United States with a correlation coefficient (R) of 0.465 and weighted average of 2.3%. Similarly, the statistical analysis conducted on geographies consisting of 164,685,810 people shows a weak positive correlation between the proportion of Immigrants from Sweden and percentage of population with vision disability in the United States with a correlation coefficient (R) of 0.256 and weighted average of 2.0%, a difference of 18.7%.
Vision Disability Correlation Summary
| Measurement | Alsatian | Immigrants from Sweden |
| Minimum | 1.1% | 0.27% |
| Maximum | 6.7% | 6.9% |
| Range | 5.6% | 6.6% |
| Mean | 3.2% | 2.1% |
| Median | 2.7% | 1.8% |
| Interquartile 25% (IQ1) | 2.3% | 1.5% |
| Interquartile 75% (IQ3) | 3.8% | 2.5% |
| Interquartile Range (IQR) | 1.5% | 1.1% |
| Standard Deviation (Sample) | 1.4% | 1.3% |
| Standard Deviation (Population) | 1.4% | 1.3% |
Similar Demographics by Vision Disability
Demographics Similar to Alsatians by Vision Disability
In terms of vision disability, the demographic groups most similar to Alsatians are Immigrants from Nicaragua (2.3%, a difference of 0.090%), Immigrants from West Indies (2.3%, a difference of 0.090%), French (2.3%, a difference of 0.15%), Guatemalan (2.3%, a difference of 0.19%), and Subsaharan African (2.3%, a difference of 0.21%).
| Demographics | Rating | Rank | Vision Disability |
| Immigrants | Cambodia | 1.1 /100 | #238 | Tragic 2.3% |
| English | 1.1 /100 | #239 | Tragic 2.3% |
| Panamanians | 0.9 /100 | #240 | Tragic 2.3% |
| Malaysians | 0.9 /100 | #241 | Tragic 2.3% |
| Immigrants | Panama | 0.8 /100 | #242 | Tragic 2.3% |
| Immigrants | Nicaragua | 0.6 /100 | #243 | Tragic 2.3% |
| Immigrants | West Indies | 0.6 /100 | #244 | Tragic 2.3% |
| Alsatians | 0.6 /100 | #245 | Tragic 2.3% |
| French | 0.5 /100 | #246 | Tragic 2.3% |
| Guatemalans | 0.5 /100 | #247 | Tragic 2.3% |
| Sub-Saharan Africans | 0.5 /100 | #248 | Tragic 2.3% |
| Liberians | 0.5 /100 | #249 | Tragic 2.3% |
| Bangladeshis | 0.5 /100 | #250 | Tragic 2.3% |
| Immigrants | Laos | 0.4 /100 | #251 | Tragic 2.4% |
| Immigrants | Micronesia | 0.3 /100 | #252 | Tragic 2.4% |
Demographics Similar to Immigrants from Sweden by Vision Disability
In terms of vision disability, the demographic groups most similar to Immigrants from Sweden are Immigrants from Bulgaria (2.0%, a difference of 0.020%), Ethiopian (2.0%, a difference of 0.040%), Immigrants from Indonesia (2.0%, a difference of 0.070%), Eastern European (2.0%, a difference of 0.090%), and Immigrants from Ethiopia (2.0%, a difference of 0.15%).
| Demographics | Rating | Rank | Vision Disability |
| Zimbabweans | 99.7 /100 | #39 | Exceptional 2.0% |
| Immigrants | Ireland | 99.7 /100 | #40 | Exceptional 2.0% |
| Cypriots | 99.7 /100 | #41 | Exceptional 2.0% |
| Immigrants | Ethiopia | 99.7 /100 | #42 | Exceptional 2.0% |
| Eastern Europeans | 99.7 /100 | #43 | Exceptional 2.0% |
| Immigrants | Indonesia | 99.7 /100 | #44 | Exceptional 2.0% |
| Ethiopians | 99.7 /100 | #45 | Exceptional 2.0% |
| Immigrants | Sweden | 99.7 /100 | #46 | Exceptional 2.0% |
| Immigrants | Bulgaria | 99.7 /100 | #47 | Exceptional 2.0% |
| Israelis | 99.6 /100 | #48 | Exceptional 2.0% |
| Latvians | 99.5 /100 | #49 | Exceptional 2.0% |
| Afghans | 99.5 /100 | #50 | Exceptional 2.0% |
| Tongans | 99.5 /100 | #51 | Exceptional 2.0% |
| Immigrants | Serbia | 99.4 /100 | #52 | Exceptional 2.0% |
| Immigrants | Belarus | 99.3 /100 | #53 | Exceptional 2.0% |