Alsatian vs Immigrants from Peru Poverty

COMPARE

Alsatian
Race
Ancestry
AfghanAfricanAlaska NativeAlaskan AthabascanAlbanianAleutAlsatianAmericanApacheArabArapahoArgentineanArmenianAssyrian/Chaldean/SyriacAustralianAustrianBahamianBangladeshiBarbadianBasqueBelgianBelizeanBermudanBhutaneseBlackfeetBolivianBrazilianBritishBritish West IndianBulgarianBurmeseCajunCambodianCanadianCape VerdeanCarpatho RusynCelticCentral AmericanCentral American IndianCherokeeCheyenneChickasawChileanChineseChippewaChoctawColombianColvilleComancheCosta RicanCreeCreekCroatianCrowCubanCypriotCzechCzechoslovakianDanishDelawareDominicanDutchDutch West IndianEastern EuropeanEcuadorianEgyptianEnglishEstonianEthiopianEuropeanFijianFilipinoFinnishFrenchFrench American IndianFrench CanadianGermanGerman RussianGhanaianGreekGuamanian/ChamorroGuatemalanGuyaneseHaitianHmongHonduranHopiHoumaHungarianIcelanderIndian (Asian)IndonesianInupiatIranianIraqiIrishIroquoisIsraeliItalianJamaicanJapaneseJordanianKenyanKiowaKoreanLaotianLatvianLebaneseLiberianLithuanianLumbeeLuxembourgerMacedonianMalaysianMalteseMarshalleseMenomineeMexicanMexican American IndianMongolianMoroccanNative HawaiianNavajoNepaleseNew ZealanderNicaraguanNigerianNorthern EuropeanNorwegianOkinawanOsageOttawaPaiutePakistaniPalestinianPanamanianParaguayanPennsylvania GermanPeruvianPimaPolishPortuguesePotawatomiPuebloPuerto RicanPuget Sound SalishRomanianRussianSalvadoranSamoanScandinavianScotch-IrishScottishSeminoleSenegaleseSerbianShoshoneSierra LeoneanSiouxSlavicSlovakSloveneSomaliSouth AfricanSouth AmericanSouth American IndianSoviet UnionSpaniardSpanishSpanish AmericanSpanish American IndianSri LankanSubsaharan AfricanSudaneseSwedishSwissSyrianTaiwaneseThaiTlingit-HaidaTohono O'OdhamTonganTrinidadian and TobagonianTsimshianTurkishU.S. Virgin IslanderUgandanUkrainianUruguayanUteVenezuelanVietnameseWelshWest IndianYakamaYaquiYugoslavianYumanYup'ikZimbabwean
Immigration
NonimmigrantsImmigrantsAfghanistanAfricaAlbaniaArgentinaArmeniaAsiaAustraliaAustriaBahamasBangladeshBarbadosBelarusBelgiumBelizeBoliviaBosnia and HerzegovinaBrazilBulgariaBurma/MyanmarCabo VerdeCambodiaCameroonCanadaCaribbeanCentral AmericaChileChinaColombiaCongoCosta RicaCroatiaCubaCzechoslovakiaDenmarkDominicaDominican RepublicEastern AfricaEastern AsiaEastern EuropeEcuadorEgyptEl SalvadorEnglandEritreaEthiopiaEuropeFijiFranceGermanyGhanaGreeceGrenadaGuatemalaGuyanaHaitiHondurasHong KongHungaryIndiaIndonesiaIranIraqIrelandIsraelItalyJamaicaJapanJordanKazakhstanKenyaKoreaKuwaitLaosLatin AmericaLatviaLebanonLiberiaLithuaniaMalaysiaMexicoMicronesiaMiddle AfricaMoldovaMoroccoNepalNetherlandsNicaraguaNigeriaNorth AmericaNorth MacedoniaNorthern AfricaNorthern EuropeNorwayOceaniaPakistanPanamaPhilippinesPolandPortugalRomaniaRussiaSaudi ArabiaScotlandSenegalSerbiaSierra LeoneSingaporeSomaliaSouth AfricaSouth AmericaSouth Central AsiaSouth Eastern AsiaSouthern EuropeSpainSri LankaSt. Vincent and the GrenadinesSudanSwedenSwitzerlandSyriaTaiwanThailandTrinidad and TobagoTurkeyUgandaUkraineUruguayUzbekistanVenezuelaVietnamWest IndiesWestern AfricaWestern AsiaWestern EuropeYemenZaireZimbabweAzores
Immigrants from Peru
Race
Ancestry
AfghanAfricanAlaska NativeAlaskan AthabascanAlbanianAleutAmericanApacheArabArapahoArgentineanArmenianAssyrian/Chaldean/SyriacAustralianAustrianBahamianBangladeshiBarbadianBasqueBelgianBelizeanBermudanBhutaneseBlackfeetBolivianBrazilianBritishBritish West IndianBulgarianBurmeseCajunCambodianCanadianCape VerdeanCarpatho RusynCelticCentral AmericanCentral American IndianCherokeeCheyenneChickasawChileanChineseChippewaChoctawColombianColvilleComancheCosta RicanCreeCreekCroatianCrowCubanCypriotCzechCzechoslovakianDanishDelawareDominicanDutchDutch West IndianEastern EuropeanEcuadorianEgyptianEnglishEstonianEthiopianEuropeanFijianFilipinoFinnishFrenchFrench American IndianFrench CanadianGermanGerman RussianGhanaianGreekGuamanian/ChamorroGuatemalanGuyaneseHaitianHmongHonduranHopiHoumaHungarianIcelanderIndian (Asian)IndonesianInupiatIranianIraqiIrishIroquoisIsraeliItalianJamaicanJapaneseJordanianKenyanKiowaKoreanLaotianLatvianLebaneseLiberianLithuanianLumbeeLuxembourgerMacedonianMalaysianMalteseMarshalleseMenomineeMexicanMexican American IndianMongolianMoroccanNative HawaiianNavajoNepaleseNew ZealanderNicaraguanNigerianNorthern EuropeanNorwegianOkinawanOsageOttawaPaiutePakistaniPalestinianPanamanianParaguayanPennsylvania GermanPeruvianPimaPolishPortuguesePotawatomiPuebloPuerto RicanPuget Sound SalishRomanianRussianSalvadoranSamoanScandinavianScotch-IrishScottishSeminoleSenegaleseSerbianShoshoneSierra LeoneanSiouxSlavicSlovakSloveneSomaliSouth AfricanSouth AmericanSouth American IndianSoviet UnionSpaniardSpanishSpanish AmericanSpanish American IndianSri LankanSubsaharan AfricanSudaneseSwedishSwissSyrianTaiwaneseThaiTlingit-HaidaTohono O'OdhamTonganTrinidadian and TobagonianTsimshianTurkishU.S. Virgin IslanderUgandanUkrainianUruguayanUteVenezuelanVietnameseWelshWest IndianYakamaYaquiYugoslavianYumanYup'ikZimbabwean
Immigration
NonimmigrantsImmigrantsAfghanistanAfricaAlbaniaArgentinaArmeniaAsiaAustraliaAustriaBahamasBangladeshBarbadosBelarusBelgiumBelizeBoliviaBosnia and HerzegovinaBrazilBulgariaBurma/MyanmarCabo VerdeCambodiaCameroonCanadaCaribbeanCentral AmericaChileChinaColombiaCongoCosta RicaCroatiaCubaCzechoslovakiaDenmarkDominicaDominican RepublicEastern AfricaEastern AsiaEastern EuropeEcuadorEgyptEl SalvadorEnglandEritreaEthiopiaEuropeFijiFranceGermanyGhanaGreeceGrenadaGuatemalaGuyanaHaitiHondurasHong KongHungaryIndiaIndonesiaIranIraqIrelandIsraelItalyJamaicaJapanJordanKazakhstanKenyaKoreaKuwaitLaosLatin AmericaLatviaLebanonLiberiaLithuaniaMalaysiaMexicoMicronesiaMiddle AfricaMoldovaMoroccoNepalNetherlandsNicaraguaNigeriaNorth AmericaNorth MacedoniaNorthern AfricaNorthern EuropeNorwayOceaniaPakistanPanamaPeruPhilippinesPolandPortugalRomaniaRussiaSaudi ArabiaScotlandSenegalSerbiaSierra LeoneSingaporeSomaliaSouth AfricaSouth AmericaSouth Central AsiaSouth Eastern AsiaSouthern EuropeSpainSri LankaSt. Vincent and the GrenadinesSudanSwedenSwitzerlandSyriaTaiwanThailandTrinidad and TobagoTurkeyUgandaUkraineUruguayUzbekistanVenezuelaVietnamWest IndiesWestern AfricaWestern AsiaWestern EuropeYemenZaireZimbabweAzores
Poverty
Income
Poverty
Unemployment
Labor Participation
Family Structure
Vehicle Availability
Education Level
Disability

Poverty Comparison

Alsatians

Immigrants from Peru

Tragic
Excellent
13.4%
POVERTY
2.6/ 100
METRIC RATING
221st/ 347
METRIC RANK
11.9%
POVERTY
81.1/ 100
METRIC RATING
140th/ 347
METRIC RANK

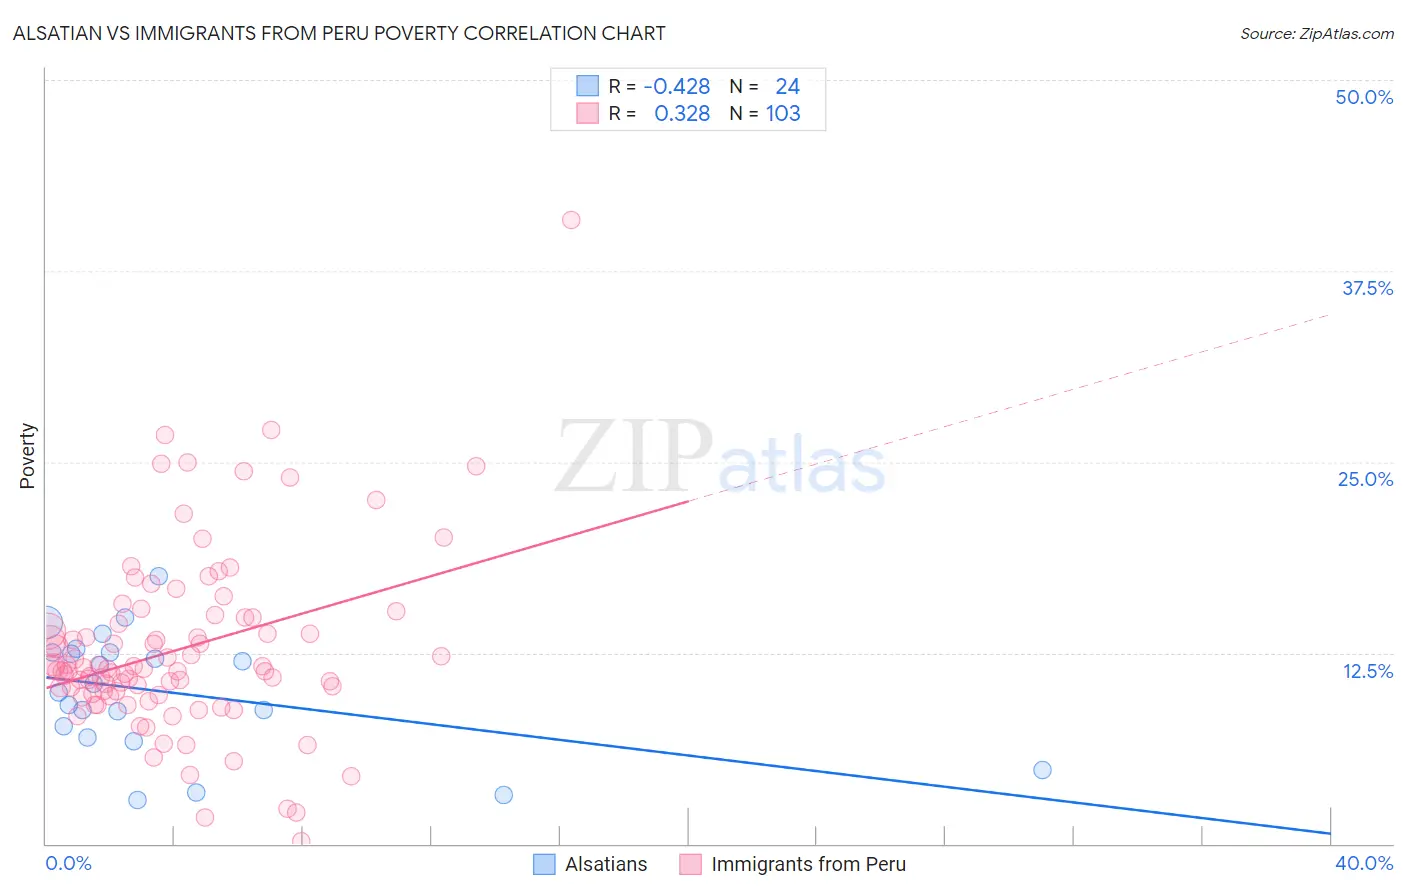
Alsatian vs Immigrants from Peru Poverty Correlation Chart

The statistical analysis conducted on geographies consisting of 82,679,902 people shows a moderate negative correlation between the proportion of Alsatians and poverty level in the United States with a correlation coefficient (R) of -0.428 and weighted average of 13.4%. Similarly, the statistical analysis conducted on geographies consisting of 328,758,820 people shows a mild positive correlation between the proportion of Immigrants from Peru and poverty level in the United States with a correlation coefficient (R) of 0.328 and weighted average of 11.9%, a difference of 12.7%.
Alsatian vs Immigrants from Peru Poverty

Poverty Correlation Summary

MeasurementAlsatianImmigrants from Peru
Minimum2.9%0.14%
Maximum17.5%40.8%
Range14.6%40.7%
Mean9.9%12.7%
Median10.2%11.4%
Interquartile 25% (IQ1)7.3%9.8%
Interquartile 75% (IQ3)12.5%14.8%
Interquartile Range (IQR)5.2%5.0%
Standard Deviation (Sample)3.9%5.9%
Standard Deviation (Population)3.8%5.9%

Similar Demographics by Poverty

Demographics Similar to Alsatians by Poverty

In terms of poverty, the demographic groups most similar to Alsatians are Immigrants from Micronesia (13.4%, a difference of 0.040%), Immigrants from Africa (13.4%, a difference of 0.080%), Immigrants from Eritrea (13.4%, a difference of 0.18%), American (13.4%, a difference of 0.20%), and Immigrants from Cambodia (13.4%, a difference of 0.29%).
DemographicsRating | RankPoverty
Bermudans
3.7
/100
|
#214
Tragic
13.3%
Japanese
3.3
/100
|
#215
Tragic
13.3%
Immigrants | Nonimmigrants
3.3
/100
|
#216
Tragic
13.3%
Immigrants | Uzbekistan
3.2
/100
|
#217
Tragic
13.3%
Immigrants | Thailand
3.1
/100
|
#218
Tragic
13.3%
Immigrants | Cambodia
3.0
/100
|
#219
Tragic
13.4%
Americans
2.9
/100
|
#220
Tragic
13.4%
Alsatians
2.6
/100
|
#221
Tragic
13.4%
Immigrants | Micronesia
2.6
/100
|
#222
Tragic
13.4%
Immigrants | Africa
2.5
/100
|
#223
Tragic
13.4%
Immigrants | Eritrea
2.4
/100
|
#224
Tragic
13.4%
German Russians
2.2
/100
|
#225
Tragic
13.4%
Marshallese
2.2
/100
|
#226
Tragic
13.4%
Alaska Natives
2.1
/100
|
#227
Tragic
13.5%
Immigrants | Nigeria
1.7
/100
|
#228
Tragic
13.5%

Demographics Similar to Immigrants from Peru by Poverty

In terms of poverty, the demographic groups most similar to Immigrants from Peru are Immigrants from France (11.9%, a difference of 0.090%), Basque (11.9%, a difference of 0.11%), Pakistani (11.9%, a difference of 0.19%), Immigrants from Jordan (11.9%, a difference of 0.22%), and Brazilian (11.9%, a difference of 0.22%).
DemographicsRating | RankPoverty
Immigrants | Western Europe
85.2
/100
|
#133
Excellent
11.8%
Yugoslavians
85.2
/100
|
#134
Excellent
11.8%
Immigrants | Vietnam
85.2
/100
|
#135
Excellent
11.8%
Chileans
84.2
/100
|
#136
Excellent
11.8%
Immigrants | Switzerland
83.0
/100
|
#137
Excellent
11.8%
Immigrants | Jordan
82.4
/100
|
#138
Excellent
11.9%
Pakistanis
82.2
/100
|
#139
Excellent
11.9%
Immigrants | Peru
81.1
/100
|
#140
Excellent
11.9%
Immigrants | France
80.5
/100
|
#141
Excellent
11.9%
Basques
80.4
/100
|
#142
Excellent
11.9%
Brazilians
79.7
/100
|
#143
Good
11.9%
Icelanders
77.9
/100
|
#144
Good
11.9%
Syrians
75.1
/100
|
#145
Good
12.0%
Afghans
74.9
/100
|
#146
Good
12.0%
Immigrants | Bosnia and Herzegovina
73.7
/100
|
#147
Good
12.0%