Alsatian vs French Canadian Female Poverty Among 18-24 Year Olds
COMPARE
Alsatian
French Canadian
Female Poverty Among 18-24 Year Olds
Female Poverty Among 18-24 Year Olds Comparison
Alsatians
French Canadians
24.4%
FEMALE POVERTY AMONG 18-24 YEAR OLDS
0.0/ 100
METRIC RATING
316th/ 347
METRIC RANK
19.9%
FEMALE POVERTY AMONG 18-24 YEAR OLDS
73.0/ 100
METRIC RATING
162nd/ 347
METRIC RANK
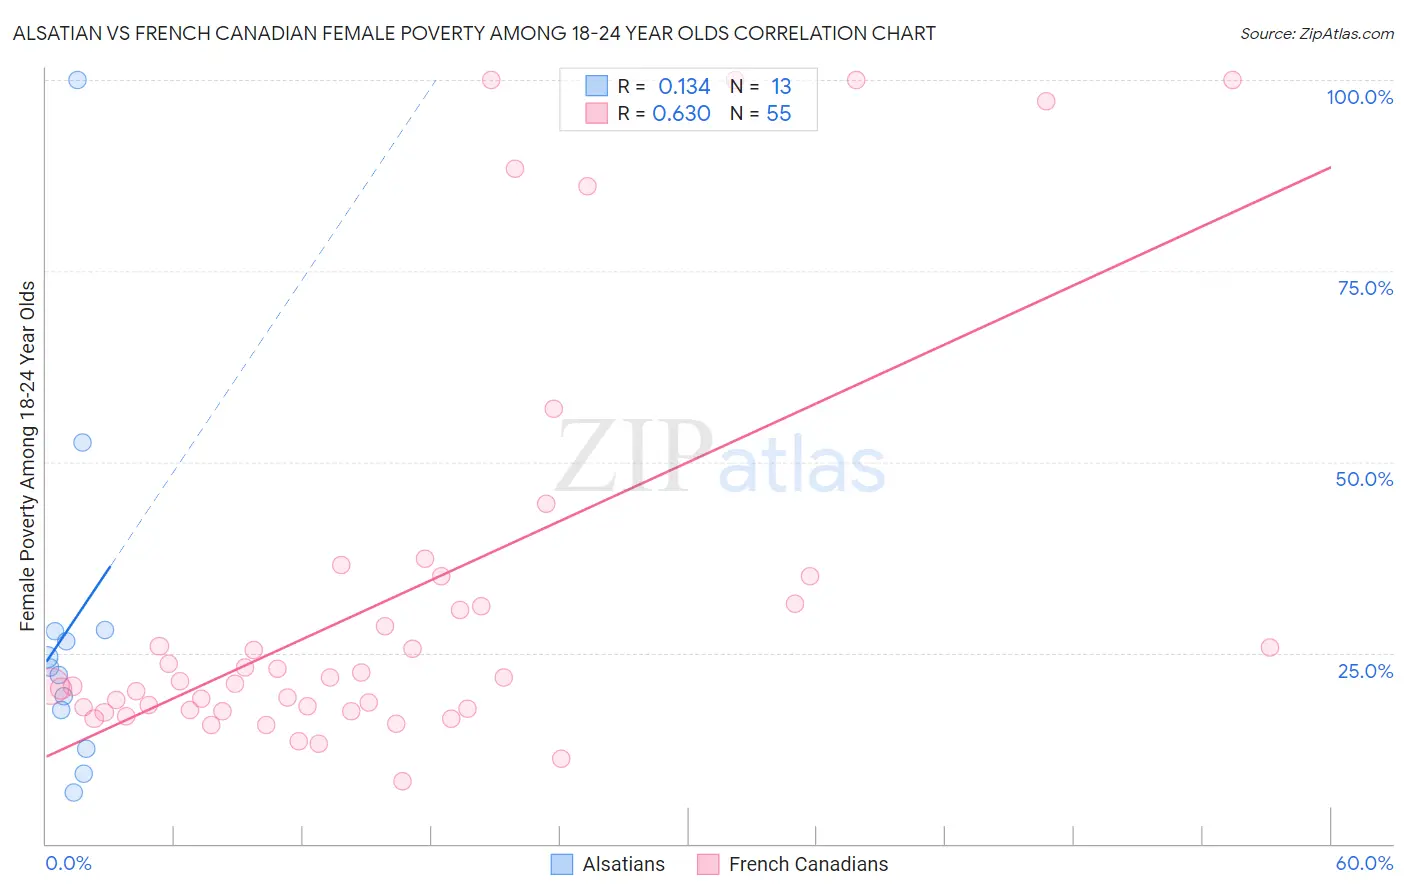
Alsatian vs French Canadian Female Poverty Among 18-24 Year Olds Correlation Chart
The statistical analysis conducted on geographies consisting of 81,760,861 people shows a poor positive correlation between the proportion of Alsatians and poverty level among females between the ages 18 and 24 in the United States with a correlation coefficient (R) of 0.134 and weighted average of 24.4%. Similarly, the statistical analysis conducted on geographies consisting of 479,685,705 people shows a significant positive correlation between the proportion of French Canadians and poverty level among females between the ages 18 and 24 in the United States with a correlation coefficient (R) of 0.630 and weighted average of 19.9%, a difference of 22.8%.
Female Poverty Among 18-24 Year Olds Correlation Summary
| Measurement | Alsatian | French Canadian |
| Minimum | 6.7% | 8.2% |
| Maximum | 100.0% | 100.0% |
| Range | 93.3% | 91.8% |
| Mean | 28.4% | 32.0% |
| Median | 23.1% | 21.3% |
| Interquartile 25% (IQ1) | 15.0% | 17.5% |
| Interquartile 75% (IQ3) | 27.9% | 31.3% |
| Interquartile Range (IQR) | 12.9% | 13.9% |
| Standard Deviation (Sample) | 24.3% | 26.1% |
| Standard Deviation (Population) | 23.3% | 25.9% |
Similar Demographics by Female Poverty Among 18-24 Year Olds
Demographics Similar to Alsatians by Female Poverty Among 18-24 Year Olds
In terms of female poverty among 18-24 year olds, the demographic groups most similar to Alsatians are Osage (24.5%, a difference of 0.29%), Black/African American (24.3%, a difference of 0.31%), Chickasaw (24.5%, a difference of 0.38%), Dutch West Indian (24.5%, a difference of 0.48%), and Choctaw (24.3%, a difference of 0.51%).
| Demographics | Rating | Rank | Female Poverty Among 18-24 Year Olds |
| Blackfeet | 0.0 /100 | #309 | Tragic 23.6% |
| Comanche | 0.0 /100 | #310 | Tragic 23.6% |
| Potawatomi | 0.0 /100 | #311 | Tragic 23.7% |
| Yuman | 0.0 /100 | #312 | Tragic 24.0% |
| Creek | 0.0 /100 | #313 | Tragic 24.2% |
| Choctaw | 0.0 /100 | #314 | Tragic 24.3% |
| Blacks/African Americans | 0.0 /100 | #315 | Tragic 24.3% |
| Alsatians | 0.0 /100 | #316 | Tragic 24.4% |
| Osage | 0.0 /100 | #317 | Tragic 24.5% |
| Chickasaw | 0.0 /100 | #318 | Tragic 24.5% |
| Dutch West Indians | 0.0 /100 | #319 | Tragic 24.5% |
| Immigrants | Congo | 0.0 /100 | #320 | Tragic 24.6% |
| Immigrants | Zaire | 0.0 /100 | #321 | Tragic 25.1% |
| Somalis | 0.0 /100 | #322 | Tragic 25.1% |
| Arapaho | 0.0 /100 | #323 | Tragic 25.2% |
Demographics Similar to French Canadians by Female Poverty Among 18-24 Year Olds
In terms of female poverty among 18-24 year olds, the demographic groups most similar to French Canadians are Malaysian (19.9%, a difference of 0.020%), Pakistani (19.8%, a difference of 0.070%), Immigrants from Belize (19.8%, a difference of 0.070%), Trinidadian and Tobagonian (19.8%, a difference of 0.090%), and Immigrants from Lebanon (19.8%, a difference of 0.15%).
| Demographics | Rating | Rank | Female Poverty Among 18-24 Year Olds |
| Hungarians | 76.6 /100 | #155 | Good 19.8% |
| Immigrants | Belgium | 76.4 /100 | #156 | Good 19.8% |
| Danes | 75.5 /100 | #157 | Good 19.8% |
| Immigrants | Lebanon | 75.3 /100 | #158 | Good 19.8% |
| Trinidadians and Tobagonians | 74.4 /100 | #159 | Good 19.8% |
| Pakistanis | 74.1 /100 | #160 | Good 19.8% |
| Immigrants | Belize | 74.1 /100 | #161 | Good 19.8% |
| French Canadians | 73.0 /100 | #162 | Good 19.9% |
| Malaysians | 72.7 /100 | #163 | Good 19.9% |
| Central Americans | 70.0 /100 | #164 | Good 19.9% |
| Eastern Europeans | 69.3 /100 | #165 | Good 19.9% |
| Belgians | 69.1 /100 | #166 | Good 19.9% |
| Czechoslovakians | 61.8 /100 | #167 | Good 20.0% |
| Fijians | 59.1 /100 | #168 | Average 20.0% |
| Hmong | 55.4 /100 | #169 | Average 20.0% |