Alsatian vs Cypriot Female Poverty Among 18-24 Year Olds
COMPARE
Alsatian
Cypriot
Female Poverty Among 18-24 Year Olds
Female Poverty Among 18-24 Year Olds Comparison
Alsatians
Cypriots
24.4%
FEMALE POVERTY AMONG 18-24 YEAR OLDS
0.0/ 100
METRIC RATING
316th/ 347
METRIC RANK
19.3%
FEMALE POVERTY AMONG 18-24 YEAR OLDS
95.5/ 100
METRIC RATING
119th/ 347
METRIC RANK
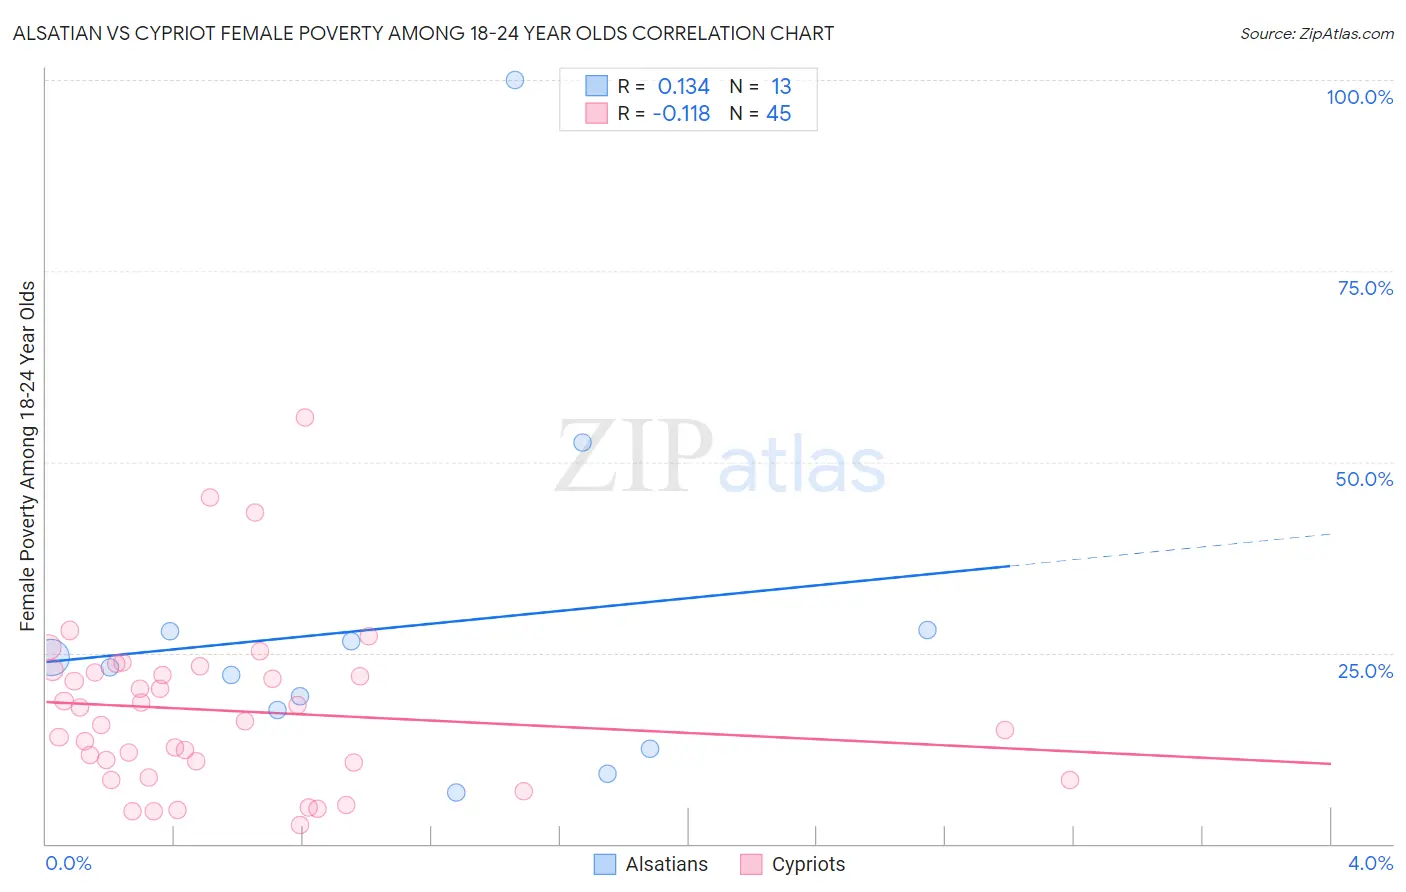
Alsatian vs Cypriot Female Poverty Among 18-24 Year Olds Correlation Chart
The statistical analysis conducted on geographies consisting of 81,760,861 people shows a poor positive correlation between the proportion of Alsatians and poverty level among females between the ages 18 and 24 in the United States with a correlation coefficient (R) of 0.134 and weighted average of 24.4%. Similarly, the statistical analysis conducted on geographies consisting of 61,185,624 people shows a poor negative correlation between the proportion of Cypriots and poverty level among females between the ages 18 and 24 in the United States with a correlation coefficient (R) of -0.118 and weighted average of 19.3%, a difference of 26.0%.
Female Poverty Among 18-24 Year Olds Correlation Summary
| Measurement | Alsatian | Cypriot |
| Minimum | 6.7% | 2.5% |
| Maximum | 100.0% | 55.9% |
| Range | 93.3% | 53.4% |
| Mean | 28.4% | 17.4% |
| Median | 23.1% | 16.0% |
| Interquartile 25% (IQ1) | 15.0% | 9.7% |
| Interquartile 75% (IQ3) | 27.9% | 22.6% |
| Interquartile Range (IQR) | 12.9% | 12.9% |
| Standard Deviation (Sample) | 24.3% | 11.1% |
| Standard Deviation (Population) | 23.3% | 10.9% |
Similar Demographics by Female Poverty Among 18-24 Year Olds
Demographics Similar to Alsatians by Female Poverty Among 18-24 Year Olds
In terms of female poverty among 18-24 year olds, the demographic groups most similar to Alsatians are Osage (24.5%, a difference of 0.29%), Black/African American (24.3%, a difference of 0.31%), Chickasaw (24.5%, a difference of 0.38%), Dutch West Indian (24.5%, a difference of 0.48%), and Choctaw (24.3%, a difference of 0.51%).
| Demographics | Rating | Rank | Female Poverty Among 18-24 Year Olds |
| Blackfeet | 0.0 /100 | #309 | Tragic 23.6% |
| Comanche | 0.0 /100 | #310 | Tragic 23.6% |
| Potawatomi | 0.0 /100 | #311 | Tragic 23.7% |
| Yuman | 0.0 /100 | #312 | Tragic 24.0% |
| Creek | 0.0 /100 | #313 | Tragic 24.2% |
| Choctaw | 0.0 /100 | #314 | Tragic 24.3% |
| Blacks/African Americans | 0.0 /100 | #315 | Tragic 24.3% |
| Alsatians | 0.0 /100 | #316 | Tragic 24.4% |
| Osage | 0.0 /100 | #317 | Tragic 24.5% |
| Chickasaw | 0.0 /100 | #318 | Tragic 24.5% |
| Dutch West Indians | 0.0 /100 | #319 | Tragic 24.5% |
| Immigrants | Congo | 0.0 /100 | #320 | Tragic 24.6% |
| Immigrants | Zaire | 0.0 /100 | #321 | Tragic 25.1% |
| Somalis | 0.0 /100 | #322 | Tragic 25.1% |
| Arapaho | 0.0 /100 | #323 | Tragic 25.2% |
Demographics Similar to Cypriots by Female Poverty Among 18-24 Year Olds
In terms of female poverty among 18-24 year olds, the demographic groups most similar to Cypriots are Immigrants from Guyana (19.3%, a difference of 0.020%), Immigrants from Northern Europe (19.4%, a difference of 0.040%), Immigrants from Iran (19.3%, a difference of 0.070%), Guyanese (19.4%, a difference of 0.070%), and Immigrants (19.3%, a difference of 0.11%).
| Demographics | Rating | Rank | Female Poverty Among 18-24 Year Olds |
| Immigrants | El Salvador | 96.5 /100 | #112 | Exceptional 19.3% |
| Immigrants | Cameroon | 96.3 /100 | #113 | Exceptional 19.3% |
| Slovenes | 96.2 /100 | #114 | Exceptional 19.3% |
| Immigrants | Hungary | 96.2 /100 | #115 | Exceptional 19.3% |
| Immigrants | Immigrants | 95.9 /100 | #116 | Exceptional 19.3% |
| Immigrants | Iran | 95.8 /100 | #117 | Exceptional 19.3% |
| Immigrants | Guyana | 95.6 /100 | #118 | Exceptional 19.3% |
| Cypriots | 95.5 /100 | #119 | Exceptional 19.3% |
| Immigrants | Northern Europe | 95.4 /100 | #120 | Exceptional 19.4% |
| Guyanese | 95.3 /100 | #121 | Exceptional 19.4% |
| Cambodians | 94.6 /100 | #122 | Exceptional 19.4% |
| Paraguayans | 94.6 /100 | #123 | Exceptional 19.4% |
| Immigrants | Chile | 94.3 /100 | #124 | Exceptional 19.4% |
| Immigrants | Panama | 94.0 /100 | #125 | Exceptional 19.4% |
| Immigrants | Russia | 93.7 /100 | #126 | Exceptional 19.4% |