Alsatian vs French Canadian Doctorate Degree
COMPARE
Alsatian
French Canadian
Doctorate Degree
Doctorate Degree Comparison
Alsatians
French Canadians
2.1%
DOCTORATE DEGREE
99.0/ 100
METRIC RATING
93rd/ 347
METRIC RANK
1.8%
DOCTORATE DEGREE
30.2/ 100
METRIC RATING
189th/ 347
METRIC RANK
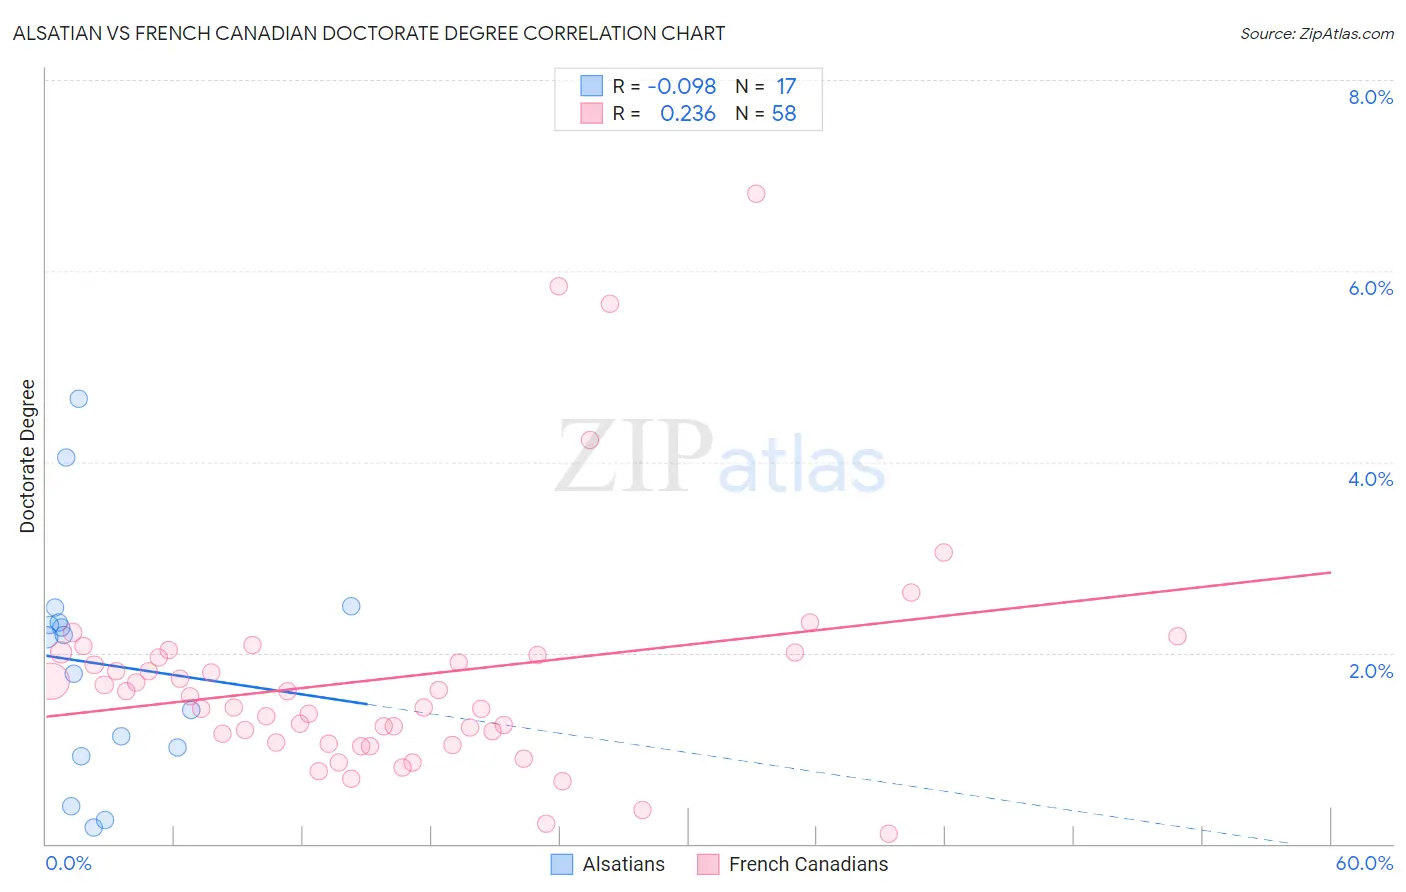
Alsatian vs French Canadian Doctorate Degree Correlation Chart
The statistical analysis conducted on geographies consisting of 82,508,744 people shows a slight negative correlation between the proportion of Alsatians and percentage of population with at least doctorate degree education in the United States with a correlation coefficient (R) of -0.098 and weighted average of 2.1%. Similarly, the statistical analysis conducted on geographies consisting of 490,873,037 people shows a weak positive correlation between the proportion of French Canadians and percentage of population with at least doctorate degree education in the United States with a correlation coefficient (R) of 0.236 and weighted average of 1.8%, a difference of 20.5%.
Doctorate Degree Correlation Summary
| Measurement | Alsatian | French Canadian |
| Minimum | 0.17% | 0.11% |
| Maximum | 4.7% | 6.8% |
| Range | 4.5% | 6.7% |
| Mean | 1.9% | 1.7% |
| Median | 2.2% | 1.5% |
| Interquartile 25% (IQ1) | 0.96% | 1.1% |
| Interquartile 75% (IQ3) | 2.4% | 2.0% |
| Interquartile Range (IQR) | 1.4% | 0.92% |
| Standard Deviation (Sample) | 1.2% | 1.2% |
| Standard Deviation (Population) | 1.2% | 1.2% |
Similar Demographics by Doctorate Degree
Demographics Similar to Alsatians by Doctorate Degree
In terms of doctorate degree, the demographic groups most similar to Alsatians are Chilean (2.2%, a difference of 0.22%), Immigrants from Sudan (2.2%, a difference of 0.48%), Greek (2.1%, a difference of 0.64%), Immigrants from Romania (2.1%, a difference of 0.78%), and Immigrants from Scotland (2.2%, a difference of 0.95%).
| Demographics | Rating | Rank | Doctorate Degree |
| Egyptians | 99.4 /100 | #86 | Exceptional 2.2% |
| Immigrants | Zimbabwe | 99.4 /100 | #87 | Exceptional 2.2% |
| Immigrants | Nepal | 99.3 /100 | #88 | Exceptional 2.2% |
| British | 99.3 /100 | #89 | Exceptional 2.2% |
| Immigrants | Scotland | 99.2 /100 | #90 | Exceptional 2.2% |
| Immigrants | Sudan | 99.1 /100 | #91 | Exceptional 2.2% |
| Chileans | 99.1 /100 | #92 | Exceptional 2.2% |
| Alsatians | 99.0 /100 | #93 | Exceptional 2.1% |
| Greeks | 98.8 /100 | #94 | Exceptional 2.1% |
| Immigrants | Romania | 98.7 /100 | #95 | Exceptional 2.1% |
| Immigrants | Northern Africa | 98.4 /100 | #96 | Exceptional 2.1% |
| Immigrants | Eritrea | 98.4 /100 | #97 | Exceptional 2.1% |
| Armenians | 98.3 /100 | #98 | Exceptional 2.1% |
| Immigrants | Egypt | 98.2 /100 | #99 | Exceptional 2.1% |
| Immigrants | Eastern Europe | 98.2 /100 | #100 | Exceptional 2.1% |
Demographics Similar to French Canadians by Doctorate Degree
In terms of doctorate degree, the demographic groups most similar to French Canadians are Immigrants from Costa Rica (1.8%, a difference of 0.020%), German (1.8%, a difference of 0.040%), South American (1.8%, a difference of 0.13%), Czechoslovakian (1.8%, a difference of 0.49%), and Dutch (1.8%, a difference of 0.52%).
| Demographics | Rating | Rank | Doctorate Degree |
| Immigrants | Afghanistan | 44.3 /100 | #182 | Average 1.8% |
| Finns | 42.1 /100 | #183 | Average 1.8% |
| Nigerians | 39.9 /100 | #184 | Fair 1.8% |
| Slovaks | 36.4 /100 | #185 | Fair 1.8% |
| Peruvians | 34.4 /100 | #186 | Fair 1.8% |
| Czechoslovakians | 33.0 /100 | #187 | Fair 1.8% |
| Germans | 30.5 /100 | #188 | Fair 1.8% |
| French Canadians | 30.2 /100 | #189 | Fair 1.8% |
| Immigrants | Costa Rica | 30.2 /100 | #190 | Fair 1.8% |
| South Americans | 29.5 /100 | #191 | Fair 1.8% |
| Dutch | 27.4 /100 | #192 | Fair 1.8% |
| German Russians | 27.1 /100 | #193 | Fair 1.8% |
| Uruguayans | 26.2 /100 | #194 | Fair 1.8% |
| Immigrants | Somalia | 25.4 /100 | #195 | Fair 1.8% |
| Sub-Saharan Africans | 25.1 /100 | #196 | Fair 1.8% |