Immigrants from Liberia vs French Canadian Female Poverty Among 18-24 Year Olds
COMPARE
Immigrants from Liberia
French Canadian
Female Poverty Among 18-24 Year Olds
Female Poverty Among 18-24 Year Olds Comparison
Immigrants from Liberia
French Canadians
20.7%
FEMALE POVERTY AMONG 18-24 YEAR OLDS
7.6/ 100
METRIC RATING
224th/ 347
METRIC RANK
19.9%
FEMALE POVERTY AMONG 18-24 YEAR OLDS
73.0/ 100
METRIC RATING
162nd/ 347
METRIC RANK
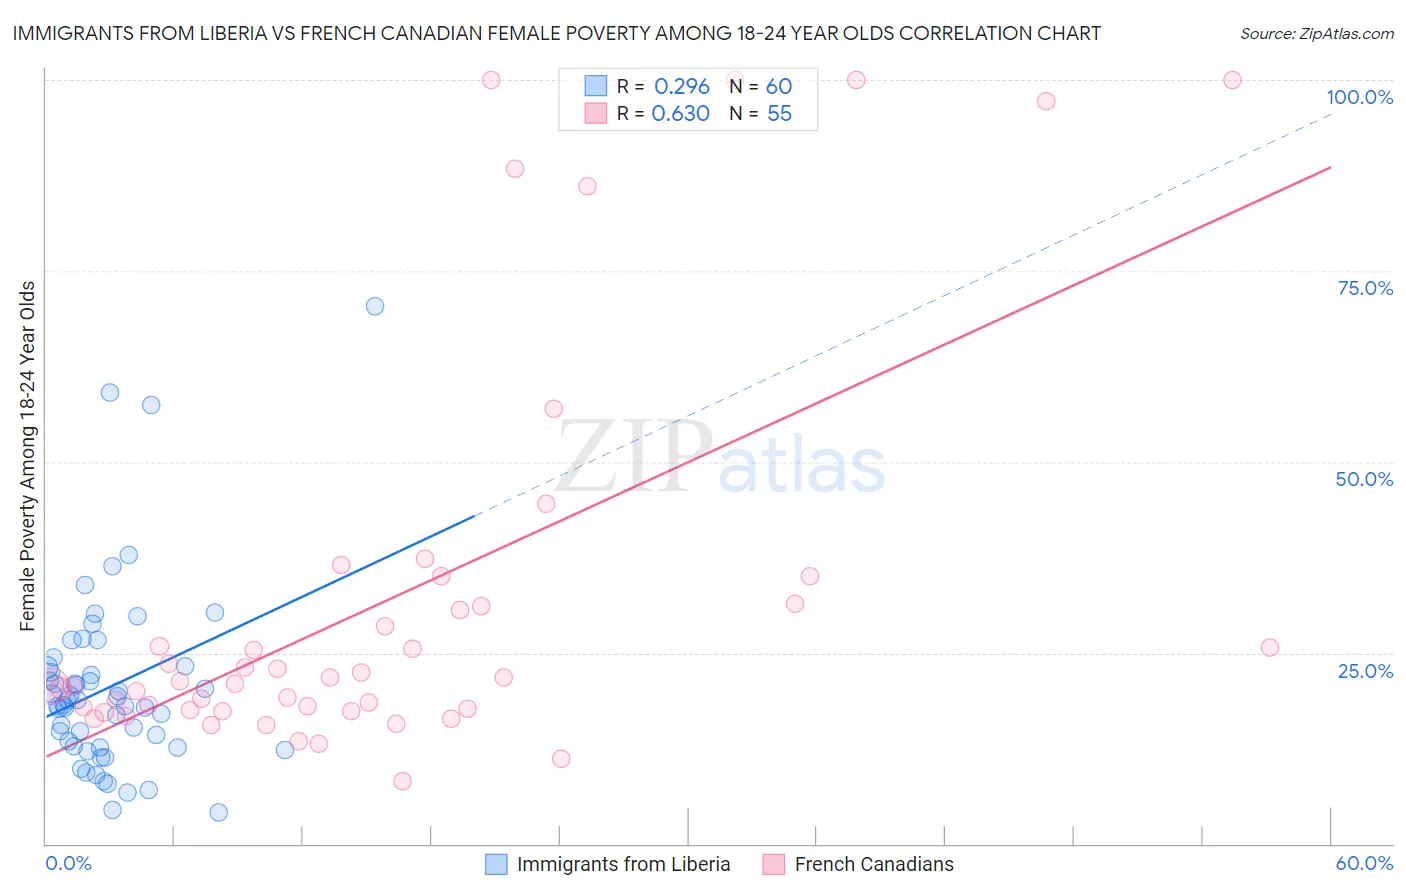
Immigrants from Liberia vs French Canadian Female Poverty Among 18-24 Year Olds Correlation Chart
The statistical analysis conducted on geographies consisting of 134,229,994 people shows a weak positive correlation between the proportion of Immigrants from Liberia and poverty level among females between the ages 18 and 24 in the United States with a correlation coefficient (R) of 0.296 and weighted average of 20.7%. Similarly, the statistical analysis conducted on geographies consisting of 479,685,705 people shows a significant positive correlation between the proportion of French Canadians and poverty level among females between the ages 18 and 24 in the United States with a correlation coefficient (R) of 0.630 and weighted average of 19.9%, a difference of 4.3%.
Female Poverty Among 18-24 Year Olds Correlation Summary
| Measurement | Immigrants from Liberia | French Canadian |
| Minimum | 4.0% | 8.2% |
| Maximum | 70.3% | 100.0% |
| Range | 66.3% | 91.8% |
| Mean | 20.5% | 32.0% |
| Median | 18.5% | 21.3% |
| Interquartile 25% (IQ1) | 12.7% | 17.5% |
| Interquartile 75% (IQ3) | 23.2% | 31.3% |
| Interquartile Range (IQR) | 10.5% | 13.9% |
| Standard Deviation (Sample) | 12.3% | 26.1% |
| Standard Deviation (Population) | 12.2% | 25.9% |
Similar Demographics by Female Poverty Among 18-24 Year Olds
Demographics Similar to Immigrants from Liberia by Female Poverty Among 18-24 Year Olds
In terms of female poverty among 18-24 year olds, the demographic groups most similar to Immigrants from Liberia are French (20.7%, a difference of 0.040%), Norwegian (20.7%, a difference of 0.060%), Guatemalan (20.7%, a difference of 0.070%), Estonian (20.7%, a difference of 0.080%), and Immigrants from Sweden (20.7%, a difference of 0.15%).
| Demographics | Rating | Rank | Female Poverty Among 18-24 Year Olds |
| Immigrants | Laos | 9.7 /100 | #217 | Tragic 20.6% |
| Immigrants | Nepal | 9.6 /100 | #218 | Tragic 20.7% |
| Immigrants | Micronesia | 9.6 /100 | #219 | Tragic 20.7% |
| British | 9.4 /100 | #220 | Tragic 20.7% |
| Barbadians | 9.0 /100 | #221 | Tragic 20.7% |
| Guatemalans | 8.1 /100 | #222 | Tragic 20.7% |
| French | 7.9 /100 | #223 | Tragic 20.7% |
| Immigrants | Liberia | 7.6 /100 | #224 | Tragic 20.7% |
| Norwegians | 7.3 /100 | #225 | Tragic 20.7% |
| Estonians | 7.2 /100 | #226 | Tragic 20.7% |
| Immigrants | Sweden | 6.8 /100 | #227 | Tragic 20.7% |
| Ghanaians | 6.5 /100 | #228 | Tragic 20.8% |
| Australians | 6.1 /100 | #229 | Tragic 20.8% |
| Whites/Caucasians | 6.1 /100 | #230 | Tragic 20.8% |
| Immigrants | St. Vincent and the Grenadines | 6.0 /100 | #231 | Tragic 20.8% |
Demographics Similar to French Canadians by Female Poverty Among 18-24 Year Olds
In terms of female poverty among 18-24 year olds, the demographic groups most similar to French Canadians are Malaysian (19.9%, a difference of 0.020%), Pakistani (19.8%, a difference of 0.070%), Immigrants from Belize (19.8%, a difference of 0.070%), Trinidadian and Tobagonian (19.8%, a difference of 0.090%), and Immigrants from Lebanon (19.8%, a difference of 0.15%).
| Demographics | Rating | Rank | Female Poverty Among 18-24 Year Olds |
| Hungarians | 76.6 /100 | #155 | Good 19.8% |
| Immigrants | Belgium | 76.4 /100 | #156 | Good 19.8% |
| Danes | 75.5 /100 | #157 | Good 19.8% |
| Immigrants | Lebanon | 75.3 /100 | #158 | Good 19.8% |
| Trinidadians and Tobagonians | 74.4 /100 | #159 | Good 19.8% |
| Pakistanis | 74.1 /100 | #160 | Good 19.8% |
| Immigrants | Belize | 74.1 /100 | #161 | Good 19.8% |
| French Canadians | 73.0 /100 | #162 | Good 19.9% |
| Malaysians | 72.7 /100 | #163 | Good 19.9% |
| Central Americans | 70.0 /100 | #164 | Good 19.9% |
| Eastern Europeans | 69.3 /100 | #165 | Good 19.9% |
| Belgians | 69.1 /100 | #166 | Good 19.9% |
| Czechoslovakians | 61.8 /100 | #167 | Good 20.0% |
| Fijians | 59.1 /100 | #168 | Average 20.0% |
| Hmong | 55.4 /100 | #169 | Average 20.0% |