Immigrants from Grenada vs French Canadian Female Poverty Among 18-24 Year Olds
COMPARE
Immigrants from Grenada
French Canadian
Female Poverty Among 18-24 Year Olds
Female Poverty Among 18-24 Year Olds Comparison
Immigrants from Grenada
French Canadians
21.2%
FEMALE POVERTY AMONG 18-24 YEAR OLDS
1.2/ 100
METRIC RATING
255th/ 347
METRIC RANK
19.9%
FEMALE POVERTY AMONG 18-24 YEAR OLDS
73.0/ 100
METRIC RATING
162nd/ 347
METRIC RANK
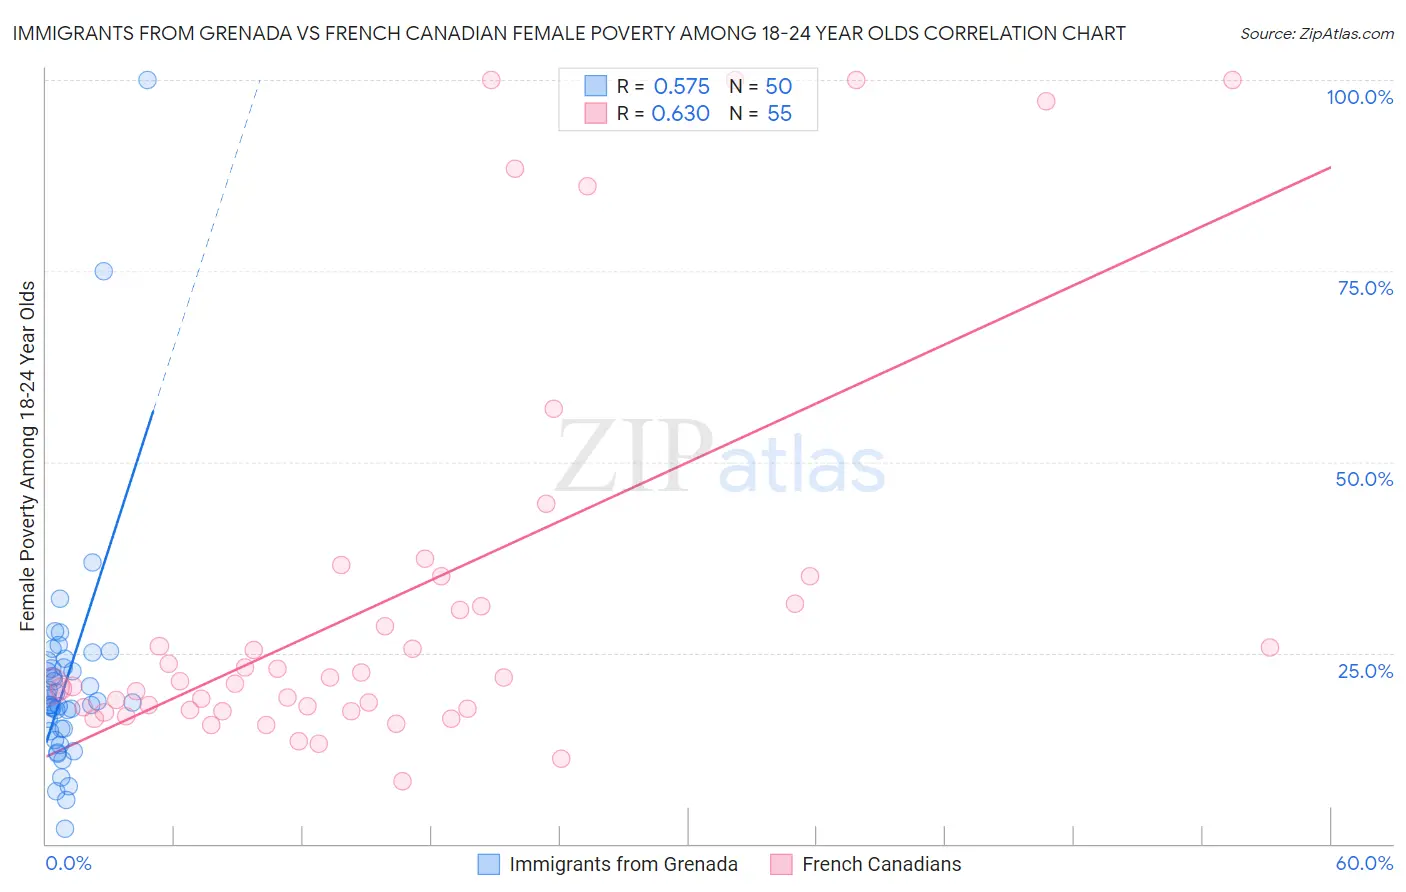
Immigrants from Grenada vs French Canadian Female Poverty Among 18-24 Year Olds Correlation Chart
The statistical analysis conducted on geographies consisting of 66,763,632 people shows a substantial positive correlation between the proportion of Immigrants from Grenada and poverty level among females between the ages 18 and 24 in the United States with a correlation coefficient (R) of 0.575 and weighted average of 21.2%. Similarly, the statistical analysis conducted on geographies consisting of 479,685,705 people shows a significant positive correlation between the proportion of French Canadians and poverty level among females between the ages 18 and 24 in the United States with a correlation coefficient (R) of 0.630 and weighted average of 19.9%, a difference of 6.7%.
Female Poverty Among 18-24 Year Olds Correlation Summary
| Measurement | Immigrants from Grenada | French Canadian |
| Minimum | 2.0% | 8.2% |
| Maximum | 100.0% | 100.0% |
| Range | 98.0% | 91.8% |
| Mean | 21.4% | 32.0% |
| Median | 18.6% | 21.3% |
| Interquartile 25% (IQ1) | 15.0% | 17.5% |
| Interquartile 75% (IQ3) | 23.1% | 31.3% |
| Interquartile Range (IQR) | 8.1% | 13.9% |
| Standard Deviation (Sample) | 15.4% | 26.1% |
| Standard Deviation (Population) | 15.2% | 25.9% |
Similar Demographics by Female Poverty Among 18-24 Year Olds
Demographics Similar to Immigrants from Grenada by Female Poverty Among 18-24 Year Olds
In terms of female poverty among 18-24 year olds, the demographic groups most similar to Immigrants from Grenada are British West Indian (21.2%, a difference of 0.030%), Tsimshian (21.2%, a difference of 0.15%), Taiwanese (21.2%, a difference of 0.26%), Delaware (21.1%, a difference of 0.32%), and South African (21.1%, a difference of 0.36%).
| Demographics | Rating | Rank | Female Poverty Among 18-24 Year Olds |
| Immigrants | Kenya | 2.5 /100 | #248 | Tragic 21.0% |
| Carpatho Rusyns | 2.5 /100 | #249 | Tragic 21.0% |
| Immigrants | West Indies | 2.2 /100 | #250 | Tragic 21.0% |
| West Indians | 1.9 /100 | #251 | Tragic 21.1% |
| South Africans | 1.6 /100 | #252 | Tragic 21.1% |
| Delaware | 1.6 /100 | #253 | Tragic 21.1% |
| British West Indians | 1.2 /100 | #254 | Tragic 21.2% |
| Immigrants | Grenada | 1.2 /100 | #255 | Tragic 21.2% |
| Tsimshian | 1.0 /100 | #256 | Tragic 21.2% |
| Taiwanese | 1.0 /100 | #257 | Tragic 21.2% |
| Vietnamese | 0.6 /100 | #258 | Tragic 21.4% |
| Immigrants | France | 0.6 /100 | #259 | Tragic 21.4% |
| Immigrants | Norway | 0.6 /100 | #260 | Tragic 21.4% |
| Immigrants | Bahamas | 0.5 /100 | #261 | Tragic 21.4% |
| Immigrants | Eastern Africa | 0.4 /100 | #262 | Tragic 21.4% |
Demographics Similar to French Canadians by Female Poverty Among 18-24 Year Olds
In terms of female poverty among 18-24 year olds, the demographic groups most similar to French Canadians are Malaysian (19.9%, a difference of 0.020%), Pakistani (19.8%, a difference of 0.070%), Immigrants from Belize (19.8%, a difference of 0.070%), Trinidadian and Tobagonian (19.8%, a difference of 0.090%), and Immigrants from Lebanon (19.8%, a difference of 0.15%).
| Demographics | Rating | Rank | Female Poverty Among 18-24 Year Olds |
| Hungarians | 76.6 /100 | #155 | Good 19.8% |
| Immigrants | Belgium | 76.4 /100 | #156 | Good 19.8% |
| Danes | 75.5 /100 | #157 | Good 19.8% |
| Immigrants | Lebanon | 75.3 /100 | #158 | Good 19.8% |
| Trinidadians and Tobagonians | 74.4 /100 | #159 | Good 19.8% |
| Pakistanis | 74.1 /100 | #160 | Good 19.8% |
| Immigrants | Belize | 74.1 /100 | #161 | Good 19.8% |
| French Canadians | 73.0 /100 | #162 | Good 19.9% |
| Malaysians | 72.7 /100 | #163 | Good 19.9% |
| Central Americans | 70.0 /100 | #164 | Good 19.9% |
| Eastern Europeans | 69.3 /100 | #165 | Good 19.9% |
| Belgians | 69.1 /100 | #166 | Good 19.9% |
| Czechoslovakians | 61.8 /100 | #167 | Good 20.0% |
| Fijians | 59.1 /100 | #168 | Average 20.0% |
| Hmong | 55.4 /100 | #169 | Average 20.0% |