Alsatian vs French Canadian Female Poverty Among 25-34 Year Olds
COMPARE
Alsatian
French Canadian
Female Poverty Among 25-34 Year Olds
Female Poverty Among 25-34 Year Olds Comparison
Alsatians
French Canadians
14.7%
FEMALE POVERTY AMONG 25-34 YEAR OLDS
1.4/ 100
METRIC RATING
238th/ 347
METRIC RANK
14.3%
FEMALE POVERTY AMONG 25-34 YEAR OLDS
5.5/ 100
METRIC RATING
216th/ 347
METRIC RANK
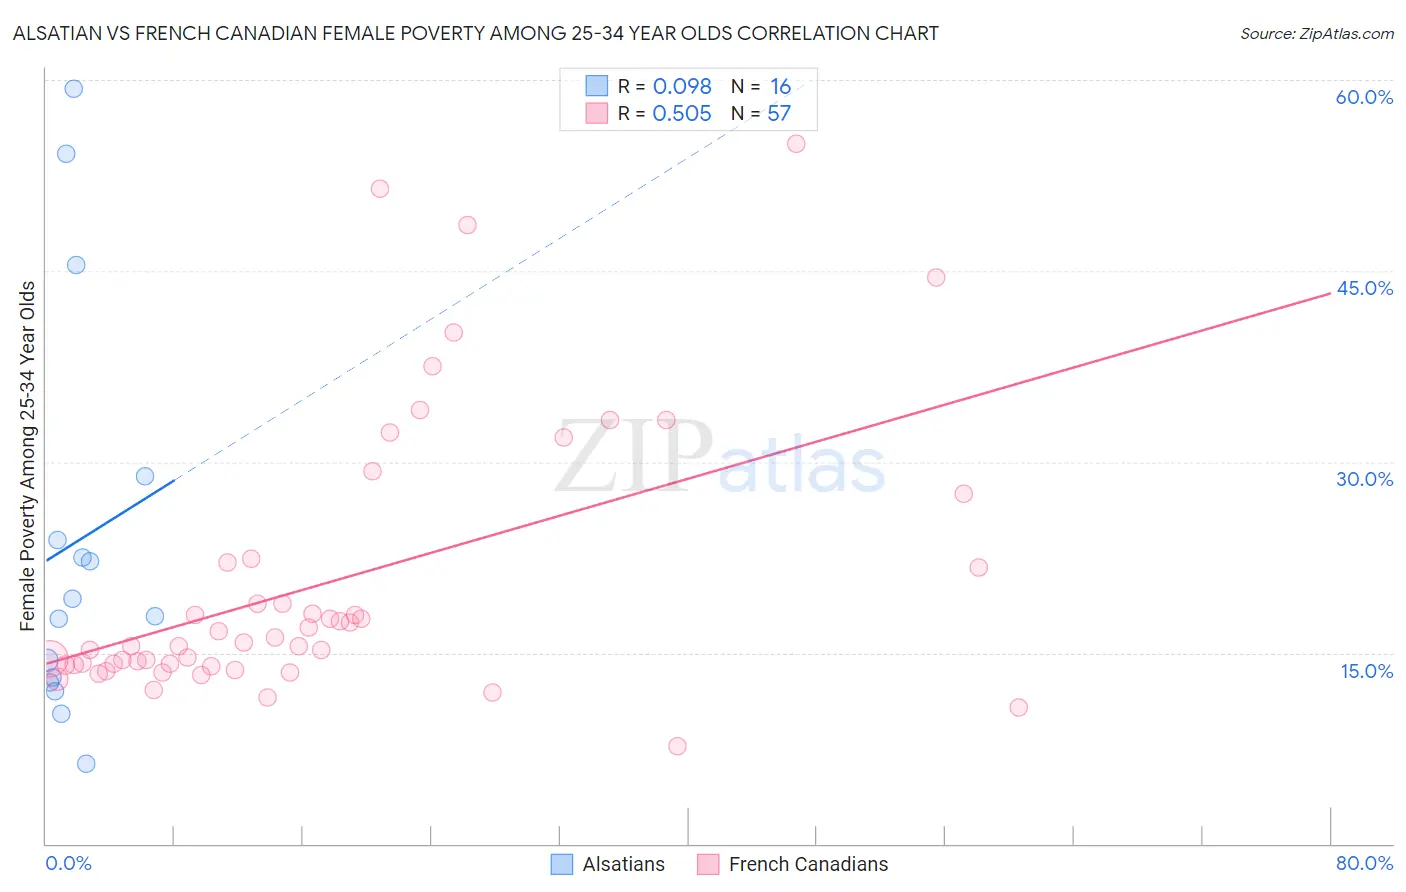
Alsatian vs French Canadian Female Poverty Among 25-34 Year Olds Correlation Chart
The statistical analysis conducted on geographies consisting of 82,102,857 people shows a slight positive correlation between the proportion of Alsatians and poverty level among females between the ages 25 and 34 in the United States with a correlation coefficient (R) of 0.098 and weighted average of 14.7%. Similarly, the statistical analysis conducted on geographies consisting of 488,016,445 people shows a substantial positive correlation between the proportion of French Canadians and poverty level among females between the ages 25 and 34 in the United States with a correlation coefficient (R) of 0.505 and weighted average of 14.3%, a difference of 2.8%.
Female Poverty Among 25-34 Year Olds Correlation Summary
| Measurement | Alsatian | French Canadian |
| Minimum | 6.2% | 7.7% |
| Maximum | 59.3% | 55.0% |
| Range | 53.1% | 47.3% |
| Mean | 23.7% | 20.6% |
| Median | 18.5% | 15.8% |
| Interquartile 25% (IQ1) | 12.9% | 14.0% |
| Interquartile 75% (IQ3) | 26.4% | 22.2% |
| Interquartile Range (IQR) | 13.4% | 8.2% |
| Standard Deviation (Sample) | 15.8% | 10.9% |
| Standard Deviation (Population) | 15.3% | 10.8% |
Similar Demographics by Female Poverty Among 25-34 Year Olds
Demographics Similar to Alsatians by Female Poverty Among 25-34 Year Olds
In terms of female poverty among 25-34 year olds, the demographic groups most similar to Alsatians are Malaysian (14.7%, a difference of 0.030%), Salvadoran (14.7%, a difference of 0.040%), Immigrants from Ghana (14.7%, a difference of 0.040%), Immigrants from Jamaica (14.7%, a difference of 0.060%), and Immigrants from Grenada (14.7%, a difference of 0.080%).
| Demographics | Rating | Rank | Female Poverty Among 25-34 Year Olds |
| Delaware | 2.3 /100 | #231 | Tragic 14.6% |
| Immigrants | Ecuador | 1.9 /100 | #232 | Tragic 14.6% |
| Whites/Caucasians | 1.8 /100 | #233 | Tragic 14.7% |
| Cubans | 1.6 /100 | #234 | Tragic 14.7% |
| Immigrants | Jamaica | 1.4 /100 | #235 | Tragic 14.7% |
| Salvadorans | 1.4 /100 | #236 | Tragic 14.7% |
| Immigrants | Ghana | 1.4 /100 | #237 | Tragic 14.7% |
| Alsatians | 1.4 /100 | #238 | Tragic 14.7% |
| Malaysians | 1.4 /100 | #239 | Tragic 14.7% |
| Immigrants | Grenada | 1.3 /100 | #240 | Tragic 14.7% |
| Scotch-Irish | 1.2 /100 | #241 | Tragic 14.8% |
| Barbadians | 1.2 /100 | #242 | Tragic 14.8% |
| Immigrants | Nicaragua | 1.1 /100 | #243 | Tragic 14.8% |
| Immigrants | Bangladesh | 1.1 /100 | #244 | Tragic 14.8% |
| Immigrants | Middle Africa | 1.0 /100 | #245 | Tragic 14.8% |
Demographics Similar to French Canadians by Female Poverty Among 25-34 Year Olds
In terms of female poverty among 25-34 year olds, the demographic groups most similar to French Canadians are Spanish American Indian (14.3%, a difference of 0.0%), Immigrants from Thailand (14.3%, a difference of 0.11%), Ecuadorian (14.3%, a difference of 0.12%), Immigrants from Nigeria (14.3%, a difference of 0.25%), and French (14.3%, a difference of 0.27%).
| Demographics | Rating | Rank | Female Poverty Among 25-34 Year Olds |
| Guyanese | 8.6 /100 | #209 | Tragic 14.2% |
| Panamanians | 8.6 /100 | #210 | Tragic 14.2% |
| Trinidadians and Tobagonians | 8.2 /100 | #211 | Tragic 14.2% |
| Immigrants | Guyana | 6.6 /100 | #212 | Tragic 14.3% |
| Puget Sound Salish | 6.5 /100 | #213 | Tragic 14.3% |
| French | 6.2 /100 | #214 | Tragic 14.3% |
| Immigrants | Nigeria | 6.2 /100 | #215 | Tragic 14.3% |
| French Canadians | 5.5 /100 | #216 | Tragic 14.3% |
| Spanish American Indians | 5.5 /100 | #217 | Tragic 14.3% |
| Immigrants | Thailand | 5.2 /100 | #218 | Tragic 14.3% |
| Ecuadorians | 5.2 /100 | #219 | Tragic 14.3% |
| Ghanaians | 4.8 /100 | #220 | Tragic 14.4% |
| Sudanese | 4.4 /100 | #221 | Tragic 14.4% |
| Immigrants | Portugal | 4.3 /100 | #222 | Tragic 14.4% |
| Nigerians | 4.2 /100 | #223 | Tragic 14.4% |