Aleut vs Venezuelan Child Poverty Among Girls Under 16
COMPARE
Aleut
Venezuelan
Child Poverty Among Girls Under 16
Child Poverty Among Girls Under 16 Comparison
Aleuts
Venezuelans
16.9%
CHILD POVERTY AMONG GIRLS UNDER 16
28.7/ 100
METRIC RATING
193rd/ 347
METRIC RANK
15.8%
CHILD POVERTY AMONG GIRLS UNDER 16
80.1/ 100
METRIC RATING
151st/ 347
METRIC RANK
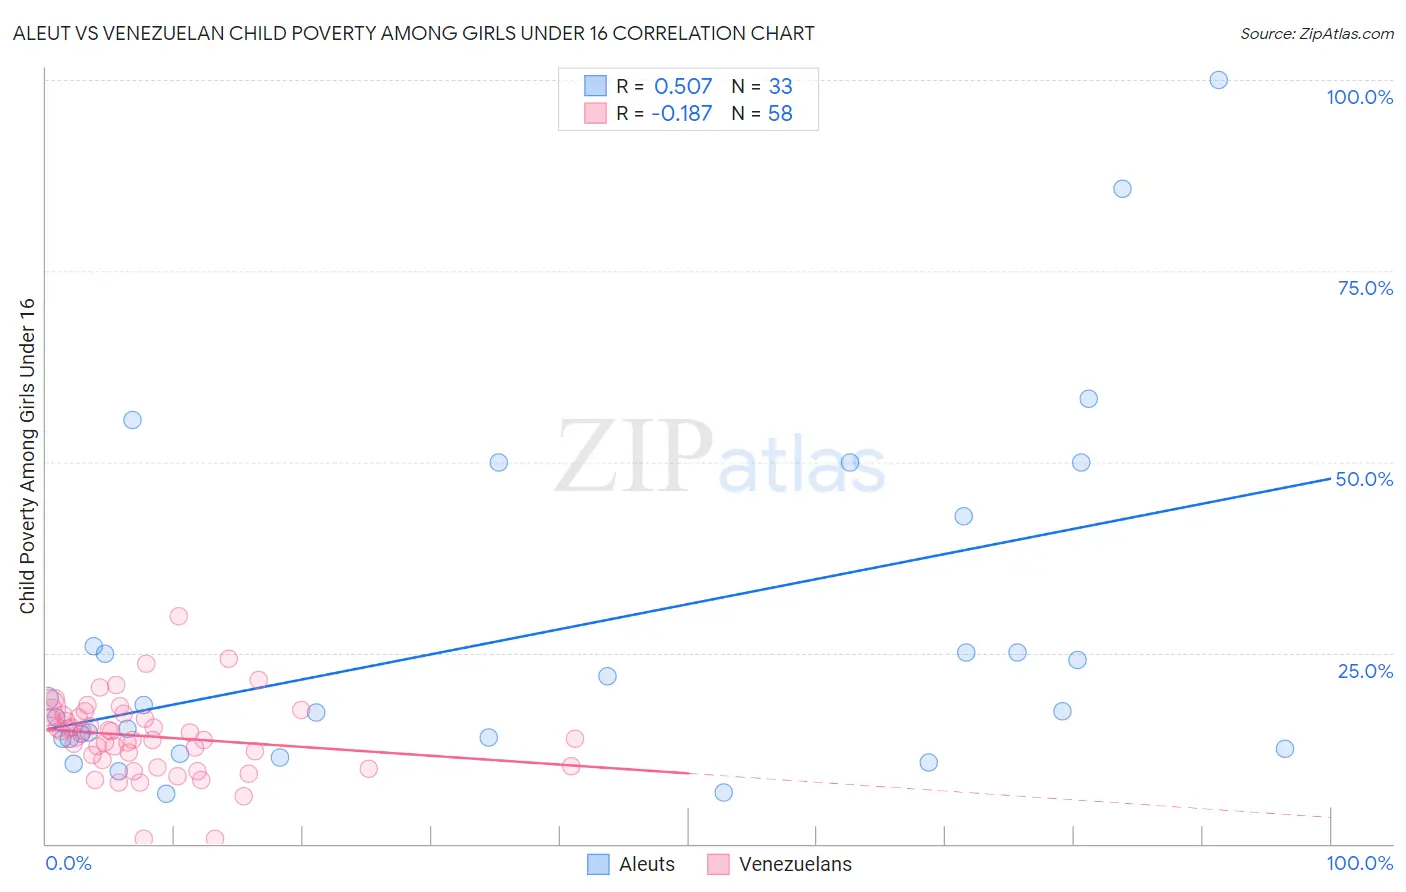
Aleut vs Venezuelan Child Poverty Among Girls Under 16 Correlation Chart
The statistical analysis conducted on geographies consisting of 61,541,696 people shows a substantial positive correlation between the proportion of Aleuts and poverty level among girls under the age of 16 in the United States with a correlation coefficient (R) of 0.507 and weighted average of 16.9%. Similarly, the statistical analysis conducted on geographies consisting of 302,424,022 people shows a poor negative correlation between the proportion of Venezuelans and poverty level among girls under the age of 16 in the United States with a correlation coefficient (R) of -0.187 and weighted average of 15.8%, a difference of 6.9%.
Child Poverty Among Girls Under 16 Correlation Summary
| Measurement | Aleut | Venezuelan |
| Minimum | 6.6% | 0.62% |
| Maximum | 100.0% | 29.7% |
| Range | 93.4% | 29.1% |
| Mean | 27.1% | 14.0% |
| Median | 17.4% | 14.3% |
| Interquartile 25% (IQ1) | 13.1% | 10.9% |
| Interquartile 75% (IQ3) | 34.4% | 16.9% |
| Interquartile Range (IQR) | 21.3% | 5.9% |
| Standard Deviation (Sample) | 22.5% | 5.1% |
| Standard Deviation (Population) | 22.2% | 5.0% |
Similar Demographics by Child Poverty Among Girls Under 16
Demographics Similar to Aleuts by Child Poverty Among Girls Under 16
In terms of child poverty among girls under 16, the demographic groups most similar to Aleuts are Spanish (16.9%, a difference of 0.010%), Immigrants from Uganda (16.8%, a difference of 0.34%), Immigrants from the Azores (16.8%, a difference of 0.35%), Immigrants from Costa Rica (17.0%, a difference of 0.44%), and Kenyan (16.8%, a difference of 0.47%).
| Demographics | Rating | Rank | Child Poverty Among Girls Under 16 |
| South American Indians | 35.0 /100 | #186 | Fair 16.8% |
| Immigrants | Morocco | 34.6 /100 | #187 | Fair 16.8% |
| Arabs | 34.5 /100 | #188 | Fair 16.8% |
| Immigrants | Bosnia and Herzegovina | 32.5 /100 | #189 | Fair 16.8% |
| Kenyans | 32.3 /100 | #190 | Fair 16.8% |
| Immigrants | Azores | 31.3 /100 | #191 | Fair 16.8% |
| Immigrants | Uganda | 31.3 /100 | #192 | Fair 16.8% |
| Aleuts | 28.7 /100 | #193 | Fair 16.9% |
| Spanish | 28.6 /100 | #194 | Fair 16.9% |
| Immigrants | Costa Rica | 25.6 /100 | #195 | Fair 17.0% |
| Celtics | 25.2 /100 | #196 | Fair 17.0% |
| Spaniards | 24.9 /100 | #197 | Fair 17.0% |
| Immigrants | Lebanon | 22.6 /100 | #198 | Fair 17.1% |
| Immigrants | Afghanistan | 22.4 /100 | #199 | Fair 17.1% |
| Immigrants | Uzbekistan | 21.5 /100 | #200 | Fair 17.1% |
Demographics Similar to Venezuelans by Child Poverty Among Girls Under 16
In terms of child poverty among girls under 16, the demographic groups most similar to Venezuelans are Immigrants from Albania (15.8%, a difference of 0.10%), Immigrants from Hungary (15.8%, a difference of 0.14%), Immigrants from Kuwait (15.8%, a difference of 0.14%), Immigrants from Nepal (15.9%, a difference of 0.29%), and Icelander (15.7%, a difference of 0.46%).
| Demographics | Rating | Rank | Child Poverty Among Girls Under 16 |
| Israelis | 86.3 /100 | #144 | Excellent 15.6% |
| Welsh | 85.4 /100 | #145 | Excellent 15.6% |
| Samoans | 84.2 /100 | #146 | Excellent 15.7% |
| Slavs | 83.1 /100 | #147 | Excellent 15.7% |
| Icelanders | 82.4 /100 | #148 | Excellent 15.7% |
| Immigrants | Hungary | 80.9 /100 | #149 | Excellent 15.8% |
| Immigrants | Albania | 80.7 /100 | #150 | Excellent 15.8% |
| Venezuelans | 80.1 /100 | #151 | Excellent 15.8% |
| Immigrants | Kuwait | 79.4 /100 | #152 | Good 15.8% |
| Immigrants | Nepal | 78.5 /100 | #153 | Good 15.9% |
| Immigrants | Chile | 76.7 /100 | #154 | Good 15.9% |
| Syrians | 76.7 /100 | #155 | Good 15.9% |
| Immigrants | Fiji | 76.1 /100 | #156 | Good 15.9% |
| Colombians | 76.1 /100 | #157 | Good 15.9% |
| Guamanians/Chamorros | 75.3 /100 | #158 | Good 15.9% |